MONMOUTH COUNTY MARKET REPORT, SEPTEMBER 2026 DATA
Skove Real Estate Team • eXp Realty • Red Bank, NJ • NJShoreRealtors.com
Monmouth County Single-Family Home Market Report
Archive Edition: This is the September 2026 archive of our Monmouth County single-family market report. For the most current data, see our live Monmouth County Market Report.
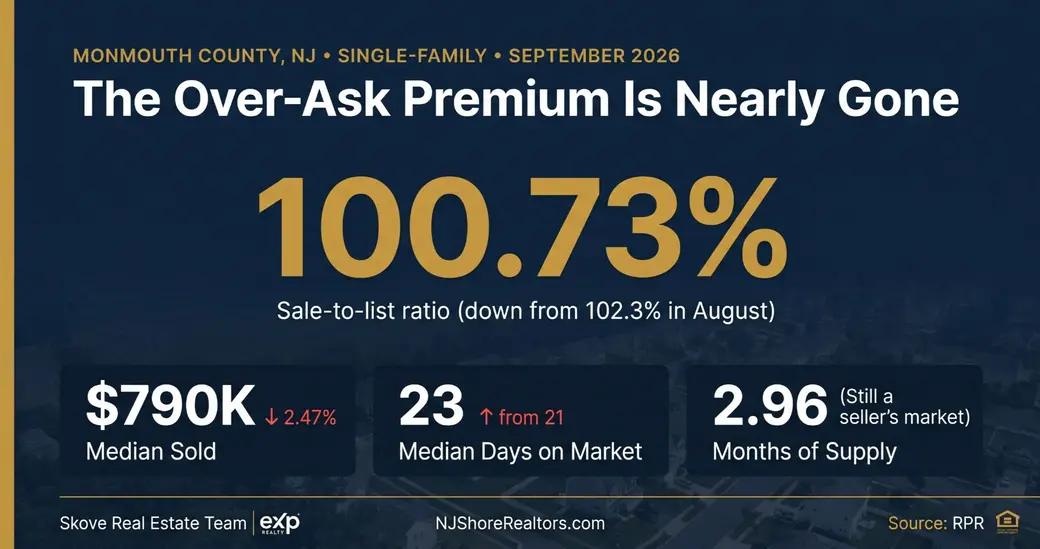
The Monmouth County single-family home market in September 2026 is a seller's market cooling into fall, with a median sold price of $790,000 — down 2.47% from August — homes selling in a median of 23 days (up from 21), and a list-to-sale ratio of 100.73%, the thinnest over-ask cushion since February. Both sides of the market stepped back at once: 527 single-family homes closed (down 12%), pending contracts fell 9.7% to 955, and active inventory dropped 3.7% to 1,492 — which is why months of supply actually tightened to 2.96. The median estimated home value stands at $873,240, up 5.08% year-over-year.
Data source: Realtors Property Resource (RPR), September 30, 2026 (estimated values as of October 31, 2026). Single-Family Residence only, Monmouth County, NJ.
Why Single-Family Data Tells a Different Story
The county-wide median sold price (all property types combined) is lower than the single-family figure. If you own or are buying a single-family home, the blended countywide number undercounts your market. Think of it like a batting average: the countywide figure includes every property type in the lineup. This report isolates the data that actually applies to single-family home sellers and buyers.
Key Market Statistics — September 2026 (Single-Family Residence)
| Metric | September 2026 | August 2026 | Month-over-Month |
|---|---|---|---|
| Median Sold Price (SFR) | $790,000 | $810,000 | ↓ 2.47% |
| Median Estimated Home Value† | $873,240 | $871,100 | ↑ 0.25% |
| Median Active List Price | $850,000 | $869,000 | ↓ 2.19% |
| Median New-Listing Price | $819,950 | ~$780,000 | ↑ 5.1% |
| Median Days on Market (Sold) | 23 days | 21 days | ↑ 9.5% (slower) |
| List-to-Sale Price Ratio | 100.73% | ~102.3% | ↓ 1.6% |
| Months of Supply | 2.96 months | ~3.06 months | ↓ 3.27% (tighter) |
| Active SFR Listings (County) | 1,492 | ~1,549 | ↓ 3.7% |
| Closed Sales (September 2026) | 527 | 599 | ↓ 12% |
| New Listings (September 2026) | 763 | ~787 | ↓ 3% |
| Pending Listings (end of month) | 955 | ~1,058 | ↓ 9.7% |
| Median $/sqft — New Listings | $406/sqft | ~$395/sqft | ↑ 2.8% |
| Median $/sqft — Pending | $401/sqft | ~$399/sqft | ↑ 0.5% |
| 12-Month Value Change | +5.08% • $831,060 → $873,240 • +$42,180 | ||
| 36-Month Value Change | +19.72% • $729,380 → $873,240 • +$143,860 | ||
†RPR's valuation model updates on a different cycle than its sales data; estimated value reflects October 31, 2026 vs. September 30. Figures marked ~ are August baselines back-calculated from RPR's own reported month-over-month change (RPR restates trailing months as late closings are recorded). RPR's September report did not publish an aggregate closed $/sqft figure; it shows new-listing and pending $/sqft instead. Source: Realtors Property Resource (RPR). Estimated values are model-generated, not formal appraisals.
Market Analysis — What the Numbers Mean
For single-family sellers:
The headline number to watch this month isn't the median price — it's the list-to-sale ratio. At roughly 102.3% in August, a home listed at $790,000 would typically close around $808,000. At September's 100.73%, that same home closes around $796,000. That's about $12,500 of overbid premium that evaporated in one month. Think of it like the tide going out: the boats haven't run aground — the median sold price is still up 3.81% year-over-year — but the water level that lifted almost every listing above asking this spring has receded. The recent closings bear that out: of 10 sampled late-October sales, 7 closed below list, including a $4.55 million Deal home 8.98% under ask after 48 days and homes in Union Beach (94 days) and Neptune (87 days) that sat long and closed under list. New sellers haven't fully adjusted yet — September's new listings came to market at a $819,950 median, up 5.1% — and pricing into a softening market is how a listing ends up chasing it.
For single-family buyers:
This is the most negotiating room buyers have had since winter. A 23-day median DOM, a list-to-sale ratio just above 100%, and a closed sample where most homes sold under ask all point the same way: offers at or below list are getting accepted again on homes that have been on the market a few weeks. But don't confuse "cooler" with "buyer's market" — months of supply at 2.96 is still under the 3-month line, because inventory fell right alongside sales. Correctly priced homes still move: 28 Hiawatha Ave in Oceanport closed in 9 days at 3.7% over ask, and 507 15th Ave in Belmar closed in 17 days essentially at asking. Your leverage is greatest on the listings that have already sat.
The PSA perspective on the list-price gap:
The gap between the median active list price ($850,000) and the median sold price ($790,000) is now $60,000 — down from $79,450 in July. That narrowing is healthy, and it came from the right direction: active list prices fell 2.19% this month as sellers already on the market adjusted. The mixed signal is at the front of the pipeline. Homes going under contract carried a median list price of $849,000 (up 2.3%), suggesting the pending mix is tilting toward higher-priced homes — a mix effect, not proof prices are rising. Meanwhile, pending volume fell 9.7% to 955, which points to fewer closings in October. Think of pending contracts as the pipeline feeding next month's closed numbers: the pipe is narrower, but what's in it skews pricier.
Mansion Tax Note: For transactions at or above $1,000,001 — common in Deal, Rumson, Colts Neck, Manasquan, Sea Girt, and other higher-price markets — New Jersey's Mansion Tax (now the "Graduated Percent Fee," P.L. 2025, c. 69, effective July 10, 2025) is paid by the seller at a graduated rate: 1% from $1M–$2M, 2% from $2M–$2.5M, 2.5% from $2.5M–$3M, 3% from $3M–$3.5M, and 3.5% above $3.5M — applied to the full purchase price, not just the amount above each threshold. Two closings in this month's sample show why that matters. The $4,550,000 deal lands in the top bracket: about $159,250. The $1,930,000 Manasquan sale owes about $19,300 at 1% — but had it closed at $2,000,001, the rate would have jumped to 2% and the fee to roughly $40,000. Near a bracket line, a few thousand dollars of price can cost a seller more than $20,000 in tax. Factor this into your net proceeds calculation before listing, not after an offer arrives.
3-Year Price Trend — Single-Family Residence
Monmouth County SFR median values at multiple time horizons — Source: RPR, 9/30/2026 (estimated value 10/31/2026)
| Metric | Current (Sep 2026) | 12 Months Ago | Change | 36 Months Ago | Change |
|---|---|---|---|---|---|
| Median Est. Home Value | $873,240 | $831,060 | +5.08% | $729,380 | +19.72% |
| Median Sold Price | $790,000 | $761,000 | +3.81% | $660,000 | +19.7% |
| Median Sold Price (24-month) | $790,000 | $749,500 | +5.4% | — | — |
Source: Realtors Property Resource (RPR) Market Snapshot, 9/30/2026 (estimated value updated 10/31/2026). Estimated values are model-generated, not formal appraisals. Median List Price's 24- and 36-month figures are omitted from this report — RPR's own data shows list price rising 30.97% and 62.84% over those windows while sold price and estimated value moved a fraction as much, consistent with a change in RPR's list-price data source in mid-2024 rather than a real market shift.
Monthly Sales Activity — Single-Family (Last 11 Months)
Active listing inventory vs. closed sales volume, Monmouth County SFR. Source: RPR MLS data, 9/30/2026.
| Month | Active Listings | Closed Sales | Month | Active Listings | Closed Sales |
|---|---|---|---|---|---|
| Nov 2025 | ~1,260 | 433 | May 2026 | ~1,390 | 447 |
| Dec 2025 | ~1,070 | 534 | Jun 2026 | ~1,500 | 608 |
| Jan 2026 | ~1,020 | 357 | Jul 2026 | ~1,590 | 594 |
| Feb 2026 | 973 | 286 | Aug 2026 | ~1,550 | 599 |
| Mar 2026 | ~1,150 | 362 | Sep 2026 | ~1,490 | 527 |
| Apr 2026 | ~1,300 | 367 | — | — | — |
RPR's Total Sales & Active Listings chart covers 11 months this cycle (Nov 2025–Sep 2026). Active listing counts are end-of-month snapshots rounded by RPR to the nearest ten; they track closely but not identically with the Active SFR Listings figure in the Key Market Statistics table (1,492 for September). RPR has restated prior months as late closings were recorded — July now reads 594 (581 at the time of our July report) and June 608 (previously 606). Inventory peaked in July and has declined for two straight months.
Sample of Closed Single-Family Transactions — Late October 2026
Median closed price from this sample: $762,000. Median $/sqft: $408. Median days on market: 46. Only 3 of 10 sold above ask. (Small sample of the most recent closings; countywide September median sold price is $790,000.)
| Property | Closed Price | $/sqft | Sqft | DOM | List: Sale / Note |
|---|---|---|---|---|---|
| 1278 Eatontown Blvd, Oceanport 3/2 • 2,194 sqft • Built 1909 |
$950,000 | $433 | 2,194 | 58 | ↓ 4.99% — extended market time, under ask |
| 28 Hiawatha Ave, Oceanport 1/1 • 720 sqft • Built 1906 |
$700,000 | $972 | 720 | 9 | ↑ 3.7% — fastest closing in sample; small footprint inflates $/sqft |
| 507 15th Ave, Belmar 2/1 • 768 sqft • Built 1932 |
$824,000 | $1,073 | 768 | 17 | ↓ 0.11% — essentially at asking; beach-town premium |
| 37 Aspen Ave, Englishtown 2/3 • 1,365 sqft • Built 1996 |
$370,000 | $271 | 1,365 | 47 | ↓ 3.9% — lowest price in sample |
| 2520 Autumn Dr, Manasquan 6/4 • 5,028 sqft • Built 1985 |
$1,930,000 | $384 | 5,028 | 20 | ↓ 1.03% — just under the $2M Mansion Tax line |
| 897 Brookside Ave, Keyport 5/2 • 2,607 sqft • Built 1982 |
$680,000 | $261 | 2,607 | 23 | ↑ 3.19% — over ask, lowest $/sqft in sample |
| 427 Central Ave, Union Beach 4/4 • 3,200 sqft |
$942,500 | $295 | 3,200 | 94 | ↓ 1.81% — longest market time in sample |
| 8 Colleen Way, Neptune 4/3 • 2,496 sqft • Built 2002 |
$700,000 | $280 | 2,496 | 87 | ↓ 3.45% — extended market time, under ask |
| 11 Cornell Dr, Hazlet 4/2 • 1,380 sqft • Built 1958 |
$665,000 | $482 | 1,380 | 44 | ↑ 2.47% — over ask |
| 408 Crosby Ave, Deal 11/9 • 5,339 sqft • Built 2020 |
$4,550,000 | $852 | 5,339 | 48 | ↓ 8.98% — largest discount in sample; luxury tier |
Source: RPR Market Activity report / MLS, pulled 11/2/2026. Closed dates 10/30/2026–11/2/2026 — these are the 10 most recent single-family closings at the time of the pull, so they fall after the September reporting period and offer an early read on October. List-to-sale ratio as reported by RPR. $/sqft based on living area reported in MLS. Year built not reported for 427 Central Ave.
Frequently Asked Questions
What is the median single-family home price in Monmouth County right now?
The median sold price for a single-family home in Monmouth County in September 2026 is $790,000 — down 2.47% from August's $810,000 but up 3.81% from $761,000 a year ago. The median estimated home value countywide is $873,240, up 5.08% year over year. All-property figures (including condos and townhomes) show a lower blended median; single-family homes command a meaningful premium in this market.
How long does it take to sell a single-family home in Monmouth County?
Single-family homes in Monmouth County sold in a median of 23 days in September 2026, up from 21 days in August. Well-priced homes still move quickly: 28 Hiawatha Ave in Oceanport closed in 9 days at 3.7% over ask, and 507 15th Ave in Belmar closed in 17 days essentially at asking. Homes that lingered — 94 days in Union Beach, 87 days in Neptune — both closed below list price.
Are single-family homes in Monmouth County selling over asking price?
Barely. The average list-to-sale ratio for single-family homes in September 2026 is 100.73%, down from roughly 102.3% in August and the thinnest over-ask margin since February. In a sample of 10 late-October closings, only 3 sold above ask — in Oceanport (3.7%), Keyport (3.19%), and Hazlet (2.47%). Seven sold below, led by a $4.55 million Deal home that closed 8.98% under list after 48 days.
Is it a seller's or buyer's market for single-family homes in Monmouth County?
It is still a seller's market, but a cooler one. Months of supply is 2.96 — under the 3-month balanced-market threshold — because active inventory fell 3.7% to 1,492, while closings fell 12% to 527. Supply and demand pulled back together. The biggest change is pricing power: the over-ask premium has nearly disappeared, and most homes in the recent closed sample sold below list.
How much have single-family home values increased in Monmouth County?
Monmouth County single-family home values are up 5.08% year-over-year and 19.72% over three years. The median estimated value rose from $729,380 three years ago to $873,240 today—a gain of about $143,860. The median sold price rose from $660,000 to $790,000 over the same period, a gain of $130,000 (19.7%).
What is a good price per square foot for a single-family home in Monmouth County?
In September 2026, new single-family listings came to market at a median of $406 per square foot, active listings sat at $405, and homes going under contract carried a median list price of $401 per square foot. A sample of 10 recent closings had a median of $408 per square foot, ranging from $261 in Keyport to $1,073 in Belmar. Price per square foot is a useful benchmark, but location, lot, condition, and home size drive most of the variance.
What is the housing market like in Monmouth County in fall 2026?
Monmouth County's single-family market is cooling into fall. September posted 527 closings (down 12% from August), pending contracts fell 9.7% to 955, and the median sold price eased to $790,000. Homes took 23 days to sell and closed at 100.73% of list on average. Inventory also shrank, keeping months of supply at 2.96, so it remains a seller's market — but buyers have more negotiating room than at any point since winter.
Know What Your Home Is Worth in This Market
September's data shows the over-ask cushion is nearly gone — which means the list price you choose now does more of the work. The difference between a correctly priced listing and an overpriced one is offers in week one versus a price reduction in week six. Ryan Skove has closed over 750 transactions and $500M in Monmouth County real estate — and knows exactly where your home lands in this data.
Get My Home's Value Schedule a ConsultationRecent Posts