Rumson Housing Market Report | September 2026
Skove Real Estate Team • eXp Realty • Red Bank, NJ • NJShoreRealtors.com
Rumson Single-Family Home Market Report
Archive Edition: This is the September 2026 archive of our Rumson single-family market report. For the most current data, see our live Rumson Market Report.
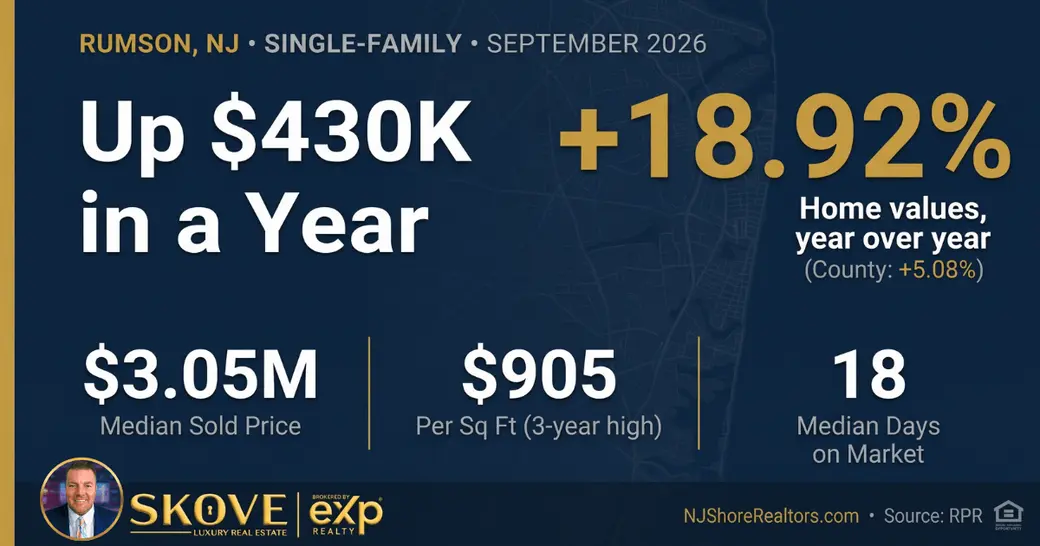
Rumson's single-family home market in September 2026 is a seller's market posting the fastest appreciation in our coverage area. The median estimated home value reached $2,703,670, up 18.92% year-over-year — a gain of more than $430,000 in 12 months. Thirteen homes closed for the second straight month at a median of $3,050,000, and buyers paid a median of $905 per square foot, the highest in the three-year RPR chart. Homes sold in a median of 18 days at an average of 99.48% of list price — just under asking for the first time since April. Months of supply rose to 2.0, still a seller's market and 18% tighter than a year ago.
Data source: Realtors Property Resource (RPR), September 30, 2026 (estimated values as of October 31, 2026). Single-Family Residence only, Rumson, NJ.
Why Single-Family Data Tells a Different Story
Rumson is one of New Jersey's premier luxury markets, and its numbers belong in a different league from the county's. Monmouth County's median estimated single-family value is $873,240; Rumson's is $2,703,670 — more than three times higher. Think of it like a batting average: a county-wide figure puts every town in the lineup, from starter homes to estates. This report isolates Rumson single-family homes, where a typical sale now lands near $3 million, and the Mansion Tax applies to almost every transaction.
Key Market Statistics — September 2026 (Single-Family Residence)
| Metric | September 2026 | August 2026 | Month-over-Month |
|---|---|---|---|
| Median Sold Price (SFR) | $3,050,000 | $3,300,000 | ↓ 7.58% |
| Median Sold $/sqft | $905/sqft | ~$850/sqft | ↑ 6.5% |
| Median Estimated Home Value† | $2,703,670 | $2,668,890 | ↑ 1.3% |
| Median Active List Price | $3,222,500 | $5,295,000 | ↓ 39.14% |
| Median New-Listing Price | $2,850,000 | ~$2,622,000 | ↑ 8.7% |
| Median Days on Market (Sold) | 18 days | 20 days | ↓ 10% (faster) |
| List-to-Sale Price Ratio | 99.48% | ~102.1% | ↓ 2.6% |
| Months of Supply | 2.0 months | ~1.67 months | ↑ 19.8% (still a seller's market) |
| Active SFR Listings | 20 | 15 | ↑ 33.3% |
| Closed Sales (September 2026) | 13 | 13 | No change |
| New Listings (September 2026) | 15 | 12 | ↑ 25% |
| New Pending Contracts (September 2026) | 8 | 12 | ↓ 33.3% |
| Pending Listings (end of month) | 21 | 26 | ↓ 19.2% |
| Median List Price — Pending | $2,300,000 | ~$2,426,000 | ↓ 5.2% |
| Median $/sqft — New / Active / Pending | $775 / $840 / $819 | ~$864 / ~$856 / ~$822 | ↓ 10.3% / ↓ 1.9% / ↓ 0.4% |
| 12-Month Value Change | +18.92% • $2,273,600 → $2,703,670 • +$430,070 | ||
| 36-Month Value Change | +32.38% • $2,042,390 → $2,703,670 • +$661,280 | ||
†RPR's valuation model updates on a different cycle than its sales data; estimated value reflects October 31, 2026 vs. September 30. Figures marked ~ are August baselines back-calculated from RPR's own reported month-over-month change. With roughly 13 closings a month spread from under $1 million to well over $5 million, Rumson's median sold price moves with the mix of homes that close; the estimated-value and $/sqft trends are steadier reads. Source: Realtors Property Resource (RPR). Estimated values are model-generated, not formal appraisals.
Market Analysis — What the Numbers Mean
For single-family sellers:
Rumson sellers are working with the strongest value gains we track: up $430,070 in a year on the median home, and a record $905 per square foot on September's sales. The best-positioned listings are still drawing aggressive offers. 82 Rumson Rd closed at $4,600,000 in 8 days, 11.52% over its asking price, and 25 Holly St sold for $2,550,000 in 10 days at 13.33% over. But the average sale dipped to 99.48% of list in September, and buyers are separating homes priced to the market from homes priced ahead of it: 82 Lafayette St took 24 days and closed 6.2% under list. Think of the list price as an opening argument — in a market this strong, a persuasive one gets a quick verdict, and an overreaching one gets cross-examined.
For single-family buyers:
You have a bit more to choose from than a month ago — 20 homes for sale, up from 15, and 15 new listings came to market in September. New contracts also slowed, from 12 in August to 8, so the pressure to decide in days has eased slightly heading into fall. Don't expect bargains on the best homes: well-priced properties are still selling in under two weeks, often above asking. The negotiating room is on listings that have been on the market a few weeks or are priced above recent comparable sales.
The PSA perspective on the price mix:
The median active list price fell 39% in September, from $5,295,000 to $3,222,500. That's not sellers slashing prices — it's a change in what's for sale. Several very high-end homes left inventory as they sold or went under contract, and new listings came in with a $2,850,000 median, so the middle of the list moved down. A cleaner signal is price per square foot, which climbed from roughly $570 in late 2025 to $905 on September closings. The figure to watch this fall is months of supply: it jumped 19.8% in one month, to 2.0 from about 1.67. If it keeps climbing toward 3, the over-ask premiums of the spring will get harder to find.
Mansion Tax Note: For transactions at or above $1,000,001, New Jersey's Mansion Tax (now the "Graduated Percent Fee," P.L. 2025, c. 69, effective July 10, 2025) is paid by the seller at a graduated rate: 1% from $1M–$2M, 2% from $2M–$2.5M, 2.5% from $2.5M–$3M, 3% from $3M–$3.5M, and 3.5% above $3.5M — applied to the full purchase price, not just the amount above each threshold. In Rumson, where the median sale is about $3 million, this is often one of the largest closing costs a seller pays. 82 Rumson Rd at $4,600,000 owes about $161,000 at 3.5%, and 52 Buena Vista Ave at $9,000,000 about $315,000. The bracket lines matter too: 25 Holly St closed at $2,550,000, in the 2.5% tier, for about $63,750. At $2,500,000, the fee would have been $50,000 — so the last $50,000 of sale price cost $13,750 in extra tax. Factor this into your pricing and net proceeds calculation before listing, not after an offer arrives.
3-Year Price Trend — Single-Family Residence
Rumson SFR median values at multiple time horizons — Source: RPR, 9/30/2026 (estimated value 10/31/2026)
| Metric | Current (Sep 2026) | 12 Months Ago | Change | 36 Months Ago | Change |
|---|---|---|---|---|---|
| Median Est. Home Value | $2,703,670 | $2,273,600 | +18.92% | $2,042,390 | +32.38% |
| Median Sold Price* | $3,050,000 | $1,999,999 | +52.5% | $2,878,000 | +5.98% |
| Median Sold Price (24-month)* | $3,050,000 | $1,705,520 | +78.83% | — | — |
Source: Realtors Property Resource (RPR) Market Snapshot, 9/30/2026 (estimated value updated 10/31/2026). *Single-month sold medians in Rumson rest on roughly 4–18 closings and swing widely with the mix of homes sold — the +52.5% one-year and +5.98% three-year figures point in very different directions for that reason. The estimated-value trend is the reliable read on appreciation. Estimated values are model-generated, not formal appraisals. Median List Price's 24- and 36-month figures are omitted — RPR's own data shows list price up 103.96% over 36 months from a flat ~$1,580,000 baseline, consistent with a change in RPR's list-price data source in mid-2024 rather than a real market shift.
Monthly Sales Activity — Single-Family (Last 11 Months)
Active listing inventory vs. closed sales volume, Rumson SFR. Source: RPR MLS data, 9/30/2026.
| Month | Active Listings | Closed Sales | Month | Active Listings | Closed Sales |
|---|---|---|---|---|---|
| Nov 2025 | 14 | 7 | May 2026 | 23 | 6 |
| Dec 2025 | 15 | 10 | Jun 2026 | 19 | 18 |
| Jan 2026 | 15 | 5 | Jul 2026 | 20 | 10 |
| Feb 2026 | 17 | 4 | Aug 2026 | 15 | 13 |
| Mar 2026 | 16 | 4 | Sep 2026 | 20 | 13 |
| Apr 2026 | 24 | 9 | — | — | — |
RPR's Total Sales & Active Listings chart covers 11 months this cycle (Nov 2025–Sep 2026). Active listings are end-of-month snapshots. June through September was Rumson's busiest stretch of the year, with 54 closings in four months. Closed sales figures may be revised as we record late transactions.
Sample of Closed Single-Family Transactions — October 2026
Median closed price from this sample: $2,145,000. Median $/sqft: $900 (MLS-listed sales). Median days on market: 10. Five sold above ask, two below, and three were public-record sales with no listing data.
| Property | Closed Price | $/sqft | Sqft | DOM | List: Sale / Note |
|---|---|---|---|---|---|
| 82 Lafayette St 3/4 • 1,972 sqft • Built 1952 |
$1,875,000 | $951 | 1,972 | 24 | ↓ 6.2% — largest discount in sample |
| 642 Locust Point Rd‡ 2/1 • 684 sqft • Built 1919 |
$677,500 | $990 | 684 | 8 | ↑ 13.11% — small cottage, quick premium sale |
| 52 Buena Vista Ave 6/7 • 7,310 sqft • 8 acres • Built 1912 |
$9,000,000 | $1,231 | 7,310 | 17 | ↓ 1.37% — estate property, near ask |
| 677 Locust Point Rd‡ 4/2 • 1,630 sqft • Built 1933 |
$615,000 | $377 | 1,630 | 66 | ↑ 2.67% — longest market time in sample |
| 5 Lakeside Ave 4/3 • 2,712 sqft • Built 2014 |
$2,415,000 | $890 | 2,712 | 9 | ↑ 0.67% — at ask in 9 days |
| 82 Rumson Rd 5/5 • 5,292 sqft • 1.43 acres • Built 1942 |
$4,600,000 | $869 | 5,292 | 8 | ↑ 11.52% — luxury bidding, 8 days |
| 944 Navesink River Rd‡ 1/1 • 1,246 sqft • Built 1952 |
$575,000 | — | 1,246 | — | Public record sale; no list data |
| 25 Holly St 4/4 • 2,832 sqft • Built 1922 |
$2,550,000 | $900 | 2,832 | 10 | ↑ 13.33% — biggest premium in sample |
| 98 W River Rd 4/5 • 2.71 acres • Built 1993 |
$18,000,000 | — | — | — | Public record transfer; no list data |
| 89 Forrest Ave 1/1 • 658 sqft • Built 1927 |
$906,000 | — | 658 | — | Public record sale; no list data |
Source: RPR Market Activity report / MLS and public records, pulled 11/4/2026. Closed dates 10/2/2026–10/30/2026 — the 10 most recent single-family closings at the time of the pull, which fall after the September reporting period. ‡Per RPR's own map, these three carry a Rumson 07760 address but sit outside the Borough of Rumson (Locust Point / Navesink River Rd area). $/sqft is shown for MLS-listed sales only; RPR's public-record square footage and price-per-square-foot figures for the three public-record entries don't reconcile, so they're omitted. List-to-sale ratio as reported by RPR.
Frequently Asked Questions
What is the median single-family home price in Rumson right now?
The median sold price for a single-family home in Rumson in September 2026 is $3,050,000, down 7.58% from August's $3,300,000, on 13 closings. The median estimated home value is $2,703,670, up 18.92% year over year. Homes currently for sale carry a median list price of $3,222,500.
How long does it take to sell a single-family home in Rumson?
Single-family homes in Rumson sold in a median of 18 days in September 2026, down from 20 in August. Well-priced homes move faster still: 82 Rumson Rd sold in 8 days and 25 Holly St in 10, both well over asking. In the 10 most recent closings, the median time on the market was 10 days.
Are single-family homes in Rumson selling over asking price?
It depends on the home. The average list-to-sale ratio in September 2026 was 99.48%, just under list and down from about 102.1% in August. But individual results vary widely: in the recent closings, 25 Holly St sold 13.33% over ask, and 82 Rumson Rd sold 11.52% over, while 82 Lafayette St sold 6.2% under. Five of the seven recent MLS-listed sales closed above asking.
Is it a seller's or buyer's market for single-family homes in Rumson?
It's a seller's market. Rumson has 2.0 months of supply — under the 3-month balanced-market threshold and 18% tighter than a year ago — with 20 single-family homes for sale and 21 under contract at the end of September. Supply did rise 19.8% from August, and new contracts slowed, so buyers have a little more room than they did over the summer.
How much have single-family home values increased in Rumson?
Rumson's median estimated single-family home value has risen 18.92% over the past 12 months and 32.38% over three years, from $2,042,390 to $2,703,670 — a gain of about $661,280. That 12-month gain is the strongest of any market in our coverage area and nearly four times Monmouth County's 5.08%.
What is a good price per square foot for a single-family home in Rumson?
Rumson single-family homes sold for a median of $905 per square foot in September 2026, up 6.5% from August and the highest in three years of RPR data. Active listings carry a median of $840 per square foot and homes under contract $819. Recent MLS sales ranged from $377 to $1,231 per square foot. Price per square foot is a useful benchmark, never a substitute for a full comparative market analysis.
What is the housing market like in Rumson in fall 2026?
Rumson is a strong seller's market starting to cool seasonally. Values are up 18.92% year over year, and September's sales set a three-year high of $905 per square foot, with 13 closings for the second straight month. At the same time, months of supply rose to 2.0, new contracts slowed to 8, and the average sale dipped just under list price, at 99.48%.
Know What Your Rumson Home Is Worth
Rumson values are up more than $430,000 in a year, and the best-priced homes are still selling in days for well over asking. At this price level, the right list price — and a clear view of your Mansion Tax bracket — can be worth six figures. Ryan Skove has closed over 750 transactions and $500M in Monmouth County real estate — and knows exactly where your home lands in this data.
Get My Home's Value Schedule a ConsultationRecent Posts