Fair Haven Housing Market Report | September 2026
Skove Real Estate Team • eXp Realty • Red Bank, NJ • NJShoreRealtors.com
Fair Haven Single-Family Home Market Report
Archive Edition: This is the September 2026 archive of our Fair Haven single-family market report. For the most current data, see our live Fair Haven Market Report.
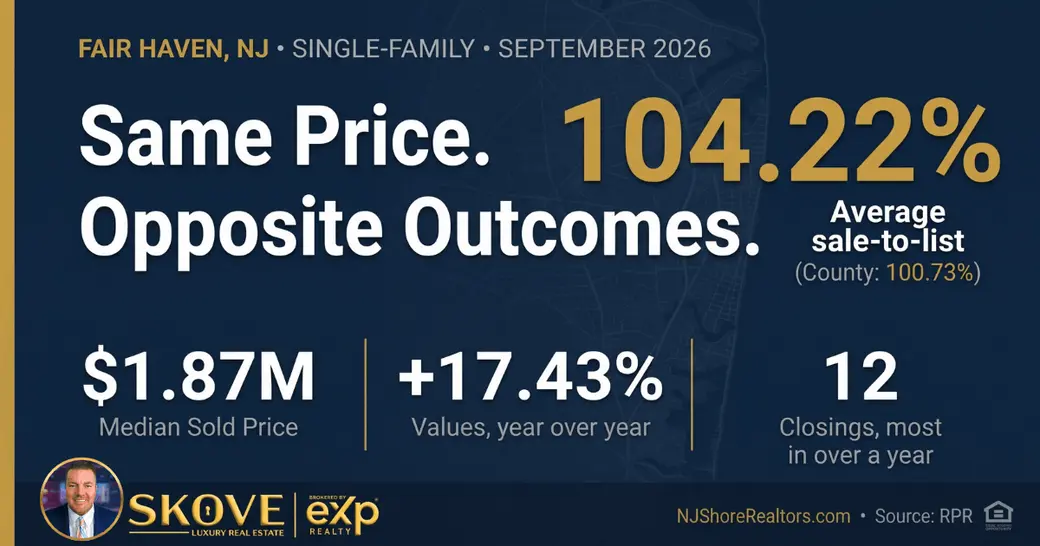
Fair Haven's single-family home market in September 2026 is a busy seller's market with values climbing fast. Twelve homes closed — more than double August's five and the most in over a year — at a median of $1,870,000, up 11.64% from August. Buyers paid an average of 104.22% of list price, and homes sold in a median of 14 days. The median estimated home value rose to $1,844,780, up 3.93% in a single month and 17.43% year-over-year — among the strongest gains in our coverage area and more than three times the county's pace. Months of supply sits at 2.0, still a seller's market, with 10 homes for sale.
Data source: Realtors Property Resource (RPR), September 30, 2026 (estimated values as of October 31, 2026). Single-Family Residence only, Fair Haven, NJ.
Why Single-Family Data Tells a Different Story
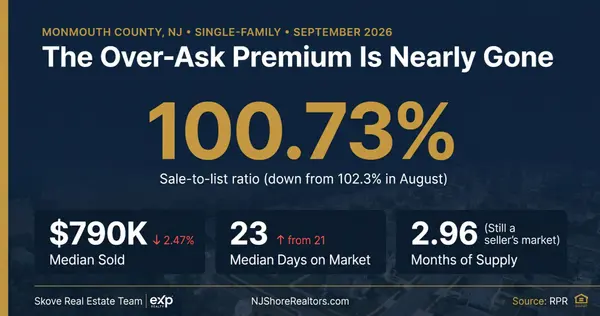
Fair Haven is almost entirely single-family, and its home values now run more than twice the Monmouth County figure: $1,844,780 versus $873,240. Think of it like a batting average: the county number puts every town and property type in the lineup. If you own or are buying in Fair Haven, the county headlines — including September's cooling trend countywide — don't describe your market. Here, buyers paid 104.22% of list in September while the county averaged 100.73%.
Key Market Statistics — September 2026 (Single-Family Residence)
| Metric | September 2026 | August 2026 | Month-over-Month |
|---|---|---|---|
| Median Sold Price (SFR) | $1,870,000 | $1,675,000 | ↑ 11.64% |
| Median Estimated Home Value† | $1,844,780 | $1,775,090 | ↑ 3.93% |
| Median Active List Price | $2,434,500 | $3,099,999 | ↓ 21.47% |
| Median New-Listing Price | $1,435,000 | ~$2,526,000 | ↓ 43.2% |
| Median Days on Market (Sold) | 14 days | 16 days | ↓ 12.5% (faster) |
| List-to-Sale Price Ratio | 104.22% | ~108.3% | ↓ 3.8% |
| Months of Supply | 2.0 months | ~1.8 months | ↑ 11.1% (still a seller's market) |
| Active SFR Listings | 10 | 9 | ↑ 11.1% |
| Closed Sales (September 2026) | 12 | 5 | ↑ 140% |
| New Listings (September 2026) | 8 | 6 | ↑ 33.3% |
| New Pending Contracts (September 2026) | 7 | 7 | No change |
| Pending Listings (end of month) | 11 | 14 | ↓ 21.4% |
| Median List Price — Pending | $1,699,000 | ~$2,148,000 | ↓ 20.9% |
| Median $/sqft — New / Active / Pending | $753 / $980 / $782 | ~$916 / ~$963 / ~$767 | ↓ 17.8% / ↑ 1.8% / ↑ 2% |
| 12-Month Value Change | +17.43% • $1,570,910 → $1,844,780 • +$273,870 | ||
| 36-Month Value Change | +36.05% • $1,355,960 → $1,844,780 • +$488,820 | ||
†RPR's valuation model updates on a different cycle than its sales data; estimated value reflects October 31, 2026 vs. September 30. Figures marked ~ are August baselines back-calculated from RPR's own reported month-over-month change. August's figures rest on just five closings, so month-over-month comparisons for sold price and list-to-sale ratio should be read with caution. RPR's September report did not publish an aggregate closed $/sqft figure; new, active, and pending $/sqft are shown instead. Source: Realtors Property Resource (RPR). Estimated values are model-generated, not formal appraisals.
Market Analysis — What the Numbers Mean
For single-family sellers:
Fair Haven's recent sales split into two clean groups, and the dividing line is time. Every home in the 10 most recent closings that sold within 13 days went over asking: 77 Jackson St by 20.31%, 12 Elmwood Ln by 20%, 75 Parker Ave by 8.12%, and 142 Pine Cove Rd by 1.7%. Every home with a reported ratio that took 24 days or more sold under. The sharpest example is two homes that both sold for exactly $999,999. 75 Parker Ave got there in 9 days, 8.12% over its list price; 343 River Rd took 24 days and closed 13.04% under its list price. Same final number, opposite stories — one priced to draw a crowd, one priced to wait for a buyer who never came at that number. Think of the first two weeks like an open house that only happens once: get the price right, and the competing offers arrive together.
For single-family buyers:
The best Fair Haven homes still sell in under two weeks with multiple offers, so if a new listing checks your boxes, be ready to move — and expect to pay over asking. Your leverage is on homes that have been listed for three weeks or more: in the recent sample, all four with a reported ratio sold below asking, by 1.4% to 13%. That includes newly built homes, which took longer to sell this fall — 94 Park Ave, built in 2026, took 44 days and sold 4.03% under list. New contracts held steady at 7, and there are 10 homes for sale, so you'll have a little more to choose from than in the spring.
The PSA perspective on the pipeline:
September's 12 closings drew down the pipeline: pending contracts fell from 14 to 11, and the pending median list price dropped 20.9% to $1,699,000. New listings also came on lower, at a $1,435,000 median, and the median active list price fell 21.5%. None of that means prices are falling — the estimated home value rose 3.93% in October alone. It means the mix of homes for sale is shifting toward the more moderate end, which tends to widen the buyer pool. One number to watch: the homes that went under contract in September took a median 44 days to get there, up from 24. Well-priced homes still go fast, but more listings are taking a second look from buyers before they commit.
Mansion Tax Note: New Jersey's Mansion Tax (now the "Graduated Percent Fee," P.L. 2025, c. 69, effective July 10, 2025) applies to sales above $1,000,000 and is paid by the seller at a graduated rate: 1% up to $2M, 2% from $2M–$2.5M, 2.5% from $2.5M–$3M, 3% from $3M–$3.5M, and 3.5% above $3.5M — applied to the full purchase price, not just the amount above each threshold. Fair Haven's recent sales show the brackets at work. Two homes closed at exactly $999,999 — just below the line, so neither seller owes the tax; at $1,000,001, each would owe about $10,000. 77 Jackson St closed at $1,955,000, in the 1% bracket, for about $19,550 — $45,000 higher and the 2% rate would have applied to the full price, roughly $40,000. At the top end, 142 Pine Cove Rd at $3,890,000 owes about $136,150, and 91 Forrest Ave at $3,195,000 about $95,850. Factor this into your pricing and net proceeds calculation before listing, not after an offer arrives.
3-Year Price Trend — Single-Family Residence
Fair Haven SFR median values at multiple time horizons — Source: RPR, 9/30/2026 (estimated value 10/31/2026)
| Metric | Current (Sep 2026) | 12 Months Ago | Change | 36 Months Ago | Change |
|---|---|---|---|---|---|
| Median Est. Home Value | $1,844,780 | $1,570,910 | +17.43% | $1,355,960 | +36.05% |
| Median Sold Price* | $1,870,000 | $1,107,500 | +68.85% | $999,000 | +87.19% |
| Median Sold Price (24-month)* | $1,870,000 | $1,627,500 | +14.9% | — | — |
Source: Realtors Property Resource (RPR) Market Snapshot, 9/30/2026 (estimated value updated 10/31/2026). *Single-month sold medians in Fair Haven rest on roughly 2–12 closings and swing with the mix of homes sold — the +68.85% one-year figure reflects a September with several $2M+ sales, not a 69% rise in values. The estimated-value trend (+17.43% in one year, +36.05% in three) is the reliable read on appreciation. Estimated values are model-generated, not formal appraisals. Median List Price's 24- and 36-month figures are omitted — RPR's own data shows list price up 260.72% over 36 months from a flat ~$674,900 baseline, consistent with a change in RPR's list-price data source in mid-2024 rather than a real market shift.
Monthly Sales Activity — Single-Family (Last 11 Months)
Active listing inventory vs. closed sales volume, Fair Haven SFR. Source: RPR MLS data, 9/30/2026.
| Month | Active Listings | Closed Sales | Month | Active Listings | Closed Sales |
|---|---|---|---|---|---|
| Nov 2025 | 9 | 6 | May 2026 | 10 | 2 |
| Dec 2025 | 9 | 5 | Jun 2026 | 11 | 11 |
| Jan 2026 | 9 | 4 | Jul 2026 | 14 | 6 |
| Feb 2026 | 4 | 5 | Aug 2026 | 9 | 5 |
| Mar 2026 | 4 | 4 | Sep 2026 | 10 | 12 |
| Apr 2026 | 6 | 3 | — | — | — |
RPR's Total Sales & Active Listings chart covers 11 months this cycle (Nov 2025–Sep 2026). Active listings are end-of-month snapshots. Fair Haven has had 14 or fewer single-family homes for sale at every month-end in this period; September's 12 closings outnumbered the 10 homes left for sale. Closed sales figures may be revised as late transactions are recorded.
Sample of Closed Single-Family Transactions — September–November 2026
Median closed price from this sample: $1,815,000. Median $/sqft: $857. Median days on market: 19. Four sold above ask, four below, two without a reported ratio — every sale within 13 days went over, and every reported sale after 24 days or more went under.
| Property | Closed Price | $/sqft | Sqft | DOM | List:Sale / Note |
|---|---|---|---|---|---|
| 240 Fair Haven Rd 3/2 • 1,922 sqft • Built 1961 |
$1,350,000 | $702 | 1,922 | 14 | No ratio reported |
| 184 Hance Rd 4/3 • 2,305 sqft • Built 1938 |
$1,140,000 | $495 | 2,305 | 56 | ↓ 5% — under ask after 56 days |
| 91 Forrest Ave 5/5 • 3,220 sqft • New construction (2026) |
$3,195,000 | $992 | 3,220 | 104 | No ratio reported — longest market time in sample |
| 93 Spruce Dr 5/3 • 2,172 sqft • Built 1950 |
$1,675,000 | $771 | 2,172 | 47 | ↓ 1.41% — slightly under ask |
| 94 Park Ave 5/6 • 3,219 sqft • New construction (2026) |
$2,975,000 | $924 | 3,219 | 44 | ↓ 4.03% — new build, under ask |
| 142 Pine Cove Rd 4/3 • 3,478 sqft • 0.69 acres • Built 1978 |
$3,890,000 | $1,118 | 3,478 | 10 | ↑ 1.7% — highest price and $/sqft in sample |
| 12 Elmwood Ln* 4/3 • 2,242 sqft |
$2,340,000 | $1,044 | 2,242 | 5 | ↑ 20% — fastest sale in sample |
| 75 Parker Ave* 3/2 • 1,236 sqft • Built 1927 |
$999,999 | $809 | 1,236 | 9 | ↑ 8.12% — over ask in 9 days |
| 343 River Rd* 4/3 • 2,896 sqft • Built 1971 |
$999,999 | $345 | 2,896 | 24 | ↓ 13.04% — largest discount in sample |
| 77 Jackson St* 4/3 • 2,160 sqft • Built 2012 |
$1,955,000 | $905 | 2,160 | 13 | ↑ 20.31% — biggest premium in sample |
Source: RPR Market Activity report / MLS, pulled 11/4/2026. Closed dates 9/25/2026–11/3/2026 — the 10 most recent single-family closings at the time of the pull. *Closed in September 2026 and part of the month's official figures; the rest closed in October or November. All 10 are inside the Borough of Fair Haven per RPR's map. List:Sale ratio as reported by RPR. $/sqft based on living area reported in MLS.
Frequently Asked Questions
What is the median single-family home price in Fair Haven right now?
The median sold price for a single-family home in Fair Haven in September 2026 is $1,870,000, up 11.64% from August, on 12 closings. The median estimated home value is $1,844,780, up 17.43% year-over-year. The 10 most recent closings had a median price of $1,815,000, and homes currently for sale carry a median list price of $2,434,500.
How long does it take to sell a single-family home in Fair Haven?
Single-family homes in Fair Haven sold in a median of 14 days in September 2026, down from 16 in August. Well-priced homes go even faster: 12 Elmwood Ln sold in 5 days and 75 Parker Ave in 9, both over asking. Homes that miss on price take longer — 184 Hance Rd took 56 days and sold 5% under list.
Are single-family homes in Fair Haven selling over asking price?
On average, yes. The list-to-sale ratio in September 2026 was 104.22%, down from about 108.3% in August but well above the county's 100.73%. In the 10 most recent closings, every home that sold within 13 days went over asking — led by 77 Jackson St at 20.31% over and 12 Elmwood Ln at 20% over — while every home with a reported ratio that took 24 days or more sold below list.
Is it a seller's or buyer's market for single-family homes in Fair Haven?
It's a seller's market. Fair Haven has 2.0 months of supply — under the 3-month balanced-market threshold — with 10 single-family homes for sale and 11 under contract at the end of September. Supply is up 17% from a year ago and 11.1% from August, so buyers have slightly more choice, but sellers still hold the advantage on well-priced homes.
How much have single-family home values increased in Fair Haven?
Fair Haven's median estimated single-family home value has risen 17.43% over the past 12 months and 36.05% over three years, from $1,355,960 to $1,844,780 — a gain of about $488,820. It also rose 3.93% in October alone. The 12-month gain is more than three times Monmouth County's 5.08%.
What is a good price per square foot for a single-family home in Fair Haven?
At the end of September 2026, active Fair Haven single-family listings carried a median of $980 per square foot, new listings $753, and homes under contract $782. The 10 most recent closings had a median of $857 per square foot, ranging from $345 to $1,118. Price per square foot is a useful benchmark, never a substitute for a full comparative market analysis.
What is the housing market like in Fair Haven in fall 2026?
Fair Haven is a busy seller's market heading into fall. September brought 12 closings — the most in over a year — at a $1,870,000 median and 104.22% of list, in a median of 14 days. Values are up 17.43% year-over-year. Pricing matters more than ever: homes that sold quickly went well over asking, while homes that sat three weeks or more sold under.
Know What Your Fair Haven Home Is Worth
This month, two Fair Haven homes sold for the exact same $999,999 — one 8% over its asking price, the other 13% under. The difference was the list price. Ryan Skove has closed over 750 transactions and $500M in Monmouth County real estate — and knows exactly where your home lands in this data.
Get My Home's Value Schedule a ConsultationRecent Posts