Oceanport Housing Market Report | October 2026
Skove Real Estate Team • eXp Realty • Red Bank, NJ • NJShoreRealtors.com
Oceanport Single-Family Home Market Report
Archive Edition: This is the October 2026 archive of our Oceanport single-family market report. For the most current data, see our live Oceanport Market Report.
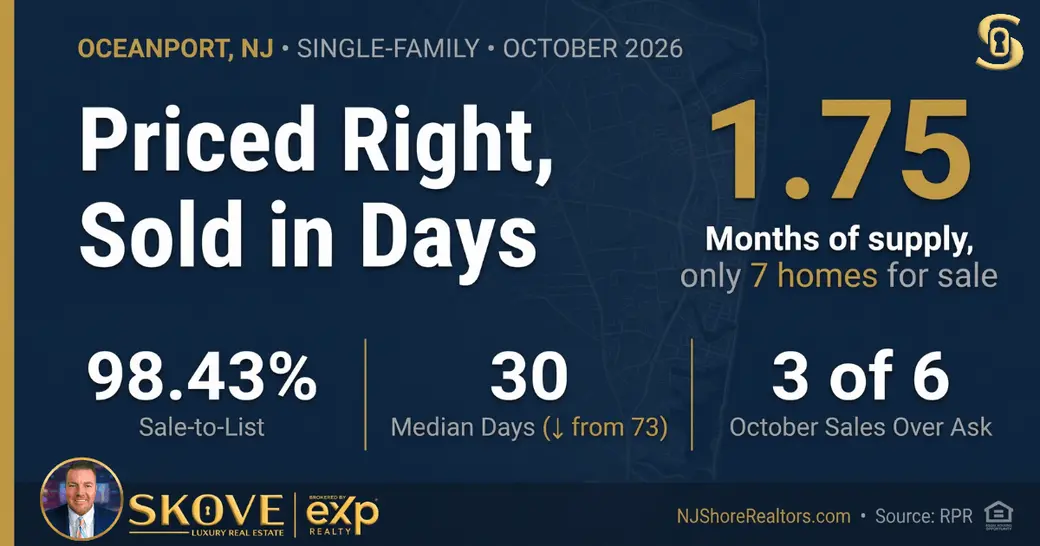
Oceanport's single-family home market in October 2026 is a seller's market where pricing decides the outcome. Sales doubled from September to six, and homes sold faster — a median of 30 days, down from 73. Buyers paid an average of 98.43% of list price, up from about 94%, but the six sales split evenly: three over asking and three under. Months of supply is 1.75, with just 7 homes for sale. The median sold price fell 40.82% to $870,000, a swing that reflects September's three sales leaning high-end rather than a drop in values. The median estimated home value is $993,230, up 3.54% year over year after slipping 2.01% in October.
Data source: Realtors Property Resource (RPR), October 31, 2026. Single-Family Residence only, Oceanport, NJ.
Why Single-Family Data Tells a Different Story
Oceanport is a small Borough on the Shrewsbury River, and its single-family market moves a handful of homes at a time — very different from Monmouth County figures that pool 53 municipalities and every property type. Think of it like a batting average: the county number puts every town in the lineup. Oceanport's estimated home value of $993,230 is roughly 14% above the county's most recent $873,240, and its 1.75 months of supply is well below the county's 2.96.
Key Market Statistics — October 2026 (Single-Family Residence)
| Metric | October 2026 | September 2026 | Month-over-Month |
|---|---|---|---|
| Median Sold Price (SFR)* | $870,000 | $1,470,000 | ↓ 40.82% |
| Median Estimated Home Value | $993,230 | $1,013,630 | ↓ 2.01% |
| Median Active List Price | $1,450,000 | $1,339,000 | ↑ 8.29% |
| Median New-Listing Price | $1,600,000 | ~$1,399,000 | ↑ 14.4% |
| Median Days on Market (Sold)* | 30 days | 73 days | ↓ 58.9% (faster) |
| List-to-Sale Price Ratio* | 98.43% | ~94% | ↑ 4.7% |
| Months of Supply | 1.75 months | 1.5 months | ↑ 16.7% (still a seller's market) |
| Active SFR Listings | 7 | 6 | ↑ 16.7% |
| Closed Sales (October 2026) | 6 | 3 | ↑ 100% |
| New Listings (October 2026) | 6 | 3 | ↑ 100% |
| New Pending Contracts (October 2026) | 3 | 5 | ↓ 40% |
| Pending Listings (end of month) | 5 | 8 | ↓ 37.5% |
| Median List Price — Pending | $999,900 | ~$872,500 | ↑ 14.6% |
| Median $/sqft — Active / Pending | $466 / $490 | ~$503 / ~$545 | ↓ 7.4% / ↓ 10.1% |
| 12-Month Value Change | +3.54% • $959,310 → $993,230 • +$33,920 | ||
| 36-Month Value Change | +16.39% • $853,380 → $993,230 • +$139,850 | ||
*Based on 6 closings in October and 3 in September; see the note below. Figures marked ~ are September baselines back-calculated from RPR's own reported month-over-month change. RPR's October report did not publish an aggregate closed $/sqft figure; it shows active and pending $/sqft instead. Source: Realtors Property Resource (RPR), October 31, 2026. Estimated values are model-generated, not formal appraisals.
Reading a 6-Sale Month: Oceanport closed six single-family homes in October, after three in September — so month-over-month swings mostly reflect which homes happened to sell. September's three sales had a $1,470,000 median; October's six ran from $736,000 to $3,000,000, with four under $900,000. Unusually, all six of October's MLS sales appear in the closed-sales table below, so you can see exactly what's behind the $870,000 median and the 98.43% average. For the long-run trend, use the estimated home value: up 3.54% in a year and 16.39% in three.
Market Analysis — What the Numbers Mean
For single-family sellers:
Low inventory alone isn't carrying Oceanport listings right now — pricing is. In the 10 most recent closings, the three homes that sold within 16 days all went over asking: 201 Comanche Dr in 9 days at 3.81% over, 28 Hiawatha Ave in 9 days at 3.7% over, and 8 Belmar Ave in 16 days at 1.52% over. Of the five that took 28 days or more, four sold about 5% to 7.27% under list, including 40 Asbury Ave (36 days, 7.27% under) and the newly built 8 Pocahontas Ave (50 days, 7.24% under). Think of the first two weeks like a tide: the buyers already waiting come in all at once. Miss it, and you're negotiating with whoever comes along next — one at a time.
For single-family buyers:
There are only 7 single-family homes for sale in Oceanport, so the selection is thin — but this is a market where patience can pay. Homes listed for four weeks or more have mostly been selling 5% to 7% below asking, and new contracts slowed to 3 in October. Well-priced homes still go quickly and over list, so if a fresh listing fits, move decisively. If one has been sitting, it's reasonable to start below asking.
The PSA perspective on the pipeline:
The pipeline is thinning. Pending contracts fell from 8 to 5, and only 3 homes went under contract in October, so November will likely bring fewer closings than October. At the same time, six new listings came on at a $1,600,000 median, and active inventory rose to 7 at a $1,450,000 median list price — well above the $870,000 median sale. That gap matters: in a market where homes priced above recent sales are the ones sitting, sellers coming to market this fall should price off what has actually closed, not off what neighbors are asking. The estimated home value's 2.01% dip in October is worth watching too, though it's still up 3.54% from a year ago.
Mansion Tax Note: For transactions at or above $1,000,001, New Jersey's Mansion Tax (now the "Graduated Percent Fee," P.L. 2025, c. 69, effective July 10, 2025) is paid by the seller at a graduated rate: 1% from $1M–$2M, 2% from $2M–$2.5M, 2.5% from $2.5M–$3M, 3% from $3M–$3.5M, and 3.5% above $3.5M — applied to the full purchase price, not just the amount above each threshold. October brought two Oceanport sales that landed exactly at the top of a bracket. 8 Pocahontas Ave closed at $2,500,000, the ceiling of the 2% tier, for about $50,000 — one dollar more and the 2.5% rate on the full price would have made it $62,500. 201 Comanche Dr closed at $3,000,000, the ceiling of the 2.5% tier, for about $75,000 — one dollar more and it would have been $90,000. Bracket lines are worth knowing before you set a price or accept an offer. Factor this into your net proceeds calculation before listing, not after an offer arrives.
3-Year Price Trend — Single-Family Residence
Oceanport SFR median values at multiple time horizons — Source: RPR, 10/31/2026
| Metric | Current (Oct 2026) | 12 Months Ago | Change | 36 Months Ago | Change |
|---|---|---|---|---|---|
| Median Est. Home Value | $993,230 | $959,310 | +3.54% | $853,380 | +16.39% |
| Median Sold Price* | $870,000 | $915,000 | −4.92% | $753,500 | +15.46% |
| Median Sold Price (24-month)* | $870,000 | $922,500 | −5.69% | — | — |
Source: Realtors Property Resource (RPR) Market Snapshot, 10/31/2026. *Oceanport single-month sold medians rest on roughly 2–8 closings and swing with the mix of homes sold; the estimated-value trend is the more reliable read on appreciation. Estimated values are model-generated, not formal appraisals. Median List Price's 24- and 36-month figures are omitted — RPR's own data shows list price up 141.69% over 36 months from a flat ~$599,949 baseline, consistent with a change in RPR's list-price data source in mid-2024 rather than a real market shift.
Monthly Sales Activity — Single-Family
Oceanport has had between 5 and 11 single-family homes for sale at every month-end over the past year, peaking at 11 in June 2026, with roughly 2 to 8 closings a month. We've left out the month-by-month table this cycle because several of RPR's monthly sales labels for this small market are missing and don't resolve to confident listing-and-sales pairs.
Sample of Closed Single-Family Transactions — September–November 2026
Median closed price from this sample: $860,000. Median $/sqft: $529 (MLS-listed sales). Median days on market: 31. Four sold above ask, four below, and two were public-record sales with no listing data.
| Property | Closed Price | $/sqft | Sqft | DOM | List: Sale / Note |
|---|---|---|---|---|---|
| 1278 Eatontown Blvd 3/2 • 2,194 sqft • 0.88 acres • Built 1909 |
$950,000 | $433 | 2,194 | 58 | ↓ 4.99% — longest time on market in sample |
| 28 Hiawatha Ave 1/1 • 720 sqft • Built 1906 |
$700,000 | $972 | 720 | 9 | ↑ 3.7% — small footprint inflates $/sqft |
| 24 Werah Pl* 3/2 • 1,399 sqft • Built 1955 |
$885,000 | $633 | 1,399 | 33 | ↑ 4.73% — biggest premium in sample |
| 40 Asbury Ave* 5/2 • 2,012 sqft • Built 1972 |
$765,000 | $380 | 2,012 | 36 | ↓ 7.27% — largest discount in sample |
| 201 Comanche Dr* 3/4 • 2,887 sqft • Built 2014 |
$3,000,000 | $1,039 | 2,887 | 9 | ↑ 3.81% — highest price in sample, 9 days |
| 49 Manitto Pl* 4/3 • 2,029 sqft • Built 1972 |
$855,000 | $421 | 2,029 | 28 | ↓ 5% — under ask |
| 8 Belmar Ave* 3/1 • 1,400 sqft • Built 1957 |
$736,000 | $526 | 1,400 | 16 | ↑ 1.52% — over ask in 16 days |
| 8 Pocahontas Ave* 6/4 • 4,700 sqft • New construction (2026) |
$2,500,000 | $532 | 4,700 | 50 | ↓ 7.24% — new build, under ask |
| 30 Hedge Dr 4/2 • 1,870 sqft • Built 1957 |
$865,000 | — | 1,870 | — | Public record sale; no list data |
| 437 Milton Ave 2/1 • 1,310 sqft • Built 1932 |
$730,000 | — | 1,310 | — | Public record sale; no list data |
Source: RPR Market Activity report / MLS and public records, pulled 11/9/2026. Closed dates 9/30/2026–11/2/2026 — the 10 most recent single-family closings at the time of the pull. *The six MLS-listed sales that make up October's official figures. All 10 are inside the Borough of Oceanport per RPR's map. $/sqft is shown for MLS-listed sales only; RPR's public-record price-per-square-foot figures don't reconcile with the listed price and size. List: Sale ratio as reported by RPR.
Frequently Asked Questions
What is the median single-family home price in Oceanport right now?
The median sold price for a single-family home in Oceanport in October 2026 is $870,000, down 40.82% from September — but September had only three sales, at a $1,470,000 median, so the drop reflects the mix of homes sold. The median estimated home value is $993,230, up 3.54% year over year. Homes currently for sale carry a median list price of $1,450,000.
How long does it take to sell a single-family home in Oceanport?
Single-family homes in Oceanport sold in a median of 30 days in October 2026, down from 73 days in September. Well-priced homes go much faster: 201 Comanche Dr and 28 Hiawatha Ave each sold in 9 days, both over asking. Homes that sat longer, like 1278 Eatontown Blvd at 58 days, sold under list.
Are single-family homes in Oceanport selling over asking price?
About half are. The average list-to-sale ratio in October 2026 was 98.43%, up from about 94% in September. October's six sales split three over asking — led by 24 Werah Pl at 4.73% over — and three under, by 5% to 7.27%. Homes that sold within about two weeks went over list; most homes that took four weeks or more sold under.
Is it a seller's or buyer's market for single-family homes in Oceanport?
It's a seller's market by supply: Oceanport has 1.75 months of single-family inventory, well under the 3-month balanced-market threshold, with just 7 homes for sale and 5 under contract. But buyers are price-sensitive — the average sale closed slightly under list in October — so sellers hold the advantage only on homes priced in line with recent sales.
How much have single-family home values increased in Oceanport?
Oceanport's median estimated single-family home value has risen 3.54% over the past 12 months and 16.39% over three years, from $853,380 to $993,230 — a gain of about $139,850. The estimate dipped 2.01% in October. Oceanport's one-year gain trails the county's most recent 5.08%.
What is a good price per square foot for a single-family home in Oceanport?
At the end of October 2026, active Oceanport single-family listings had a median price of $466 per square foot, and homes under contract had a median list price of $490. The recent MLS-listed sales had a median of $529 per square foot, ranging from $380 to $1,039. Small homes and new construction sit at the top of that range. Price per square foot is a useful benchmark, never a substitute for a full comparative market analysis.
What is the housing market like in Oceanport in fall 2026?
Oceanport is a tight but price-sensitive seller's market heading into late fall. October brought six closings, double September's, at 98.43% of list price in a median of 30 days. Supply is just 1.75 months, with 7 homes for sale. The pipeline is thinning — pending contracts fell to 5 — and new listings are coming on at higher prices than recent sales, so pricing to the market matters.
Know What Your Oceanport Home Is Worth
In Oceanport this fall, homes priced right sold in days and over asking, while homes priced above the market sat for a month or more and sold 5% to 7% under. Ryan Skove has closed over 750 transactions and $500M in Monmouth County real estate — and knows exactly where your home lands in this data.
Get My Home's Value Schedule a ConsultationRecent Posts