Monmouth County July Single Family Market Report
Skove Real Estate Team • eXp Realty • Red Bank, NJ • NJShoreRealtors.com
Monmouth County Single-Family Home Market Report
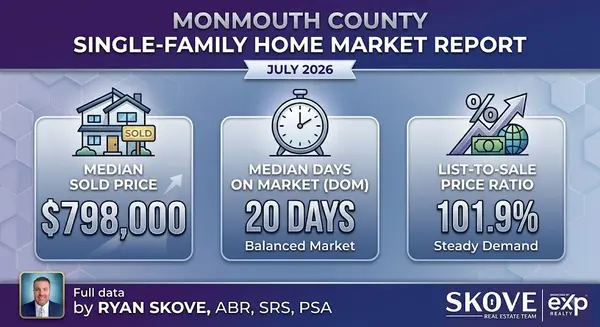
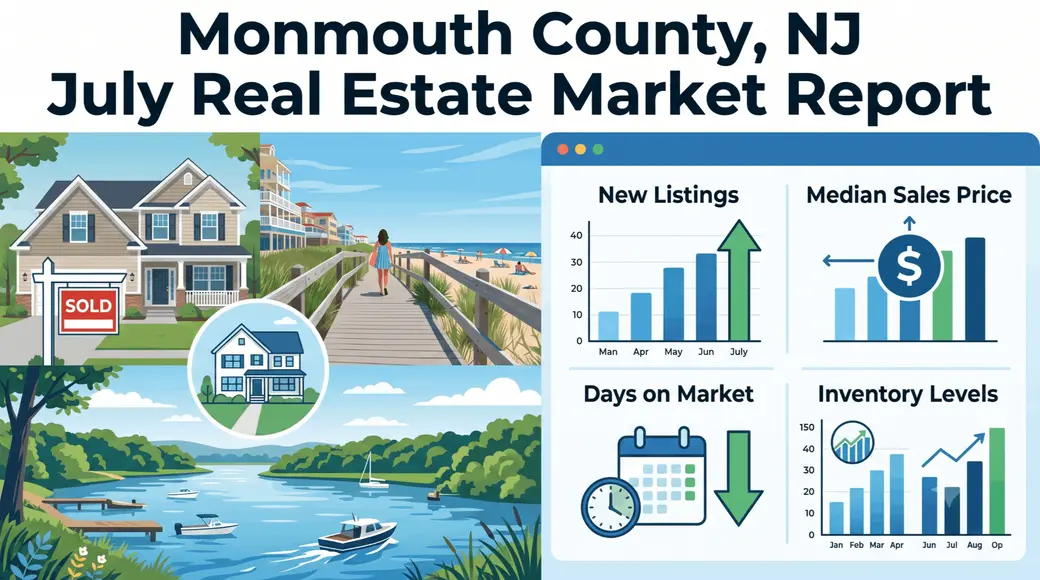
The Monmouth County single-family home market in June 2026 is a strong seller's market, with a median sold price of $815,000 — up 1.88% from May — homes selling in a median of 16 days, and a list-to-sale ratio of 102.4%. With 2.57 months of inventory and a median estimated home value of $861,420 (up 6.2% year-over-year), summer demand is accelerating: 595 single-family homes closed in June — the strongest monthly volume in over a year and a 33% jump from May.
Data source: Realtors Property Resource (RPR), June 30, 2026. Single-Family Residence only, Monmouth County, NJ.
Why Single-Family Data Tells a Different Story
The county-wide median sold price (all property types combined) is lower than the single-family figure. If you own or are buying a single-family home, the blended countywide number undercounts your market. Think of it like a batting average: the county-wide figure includes every property type in the lineup. This report isolates the data that actually applies to single-family home sellers and buyers.
Key Market Statistics — June 2026 (Single-Family Residence)
| Metric | June 2026 | May 2026 | Month-over-Month |
|---|---|---|---|
| Median Sold Price (SFR) | $815,000 | $800,000 | ↑ 1.88% |
| Median Estimated Home Value | $861,420 | $842,280 | ↑ 2.27% |
| Median Active List Price | $889,000 | $850,000 | ↑ 4.59% |
| Median Days on Market (Sold) | 16 days | ~18 days | ↓ 11.11% (faster) |
| List-to-Sale Price Ratio | 102.37% | ~101.9% | ↑ 0.5% |
| Months of Supply | 2.57 months | ~2.52 months | ↑ 1.91% (still seller's market) |
| Active SFR Listings (County) | 1,320 | ~1,320 | 0% (flat) |
| Closed Sales (June 2026) | 595 | ~447 | ↑ 33.1% MoM |
| New Listings (June 2026) | 874 | ~921 | ↓ 5.2% MoM |
| New Pending (June 2026) | 679 | ~622 | ↑ 9.2% MoM |
| Median Closed $/sqft | $408/sqft | ~$409/sqft | ↓ 0.2% |
| Total Closed $ Volume | $645,717,005 | ~$446M | ↑ 45% MoM |
| 12-Month Value Change | +6.17% • $811,340 → $861,420 • +$50,080 | ||
| 36-Month Value Change | +24.09% • $694,210 → $861,420 • +$167,210 | ||
Source: Realtors Property Resource (RPR), June 30, 2026. Estimated values are model-generated, not formal appraisals.
Market Analysis — What the Numbers Mean
For single-family sellers:
June's data is as strong as this market has delivered in over a year. The 102.37% list-to-sale ratio on closed transactions means buyers are paying over asking on correctly priced homes — and 595 closings in a single month confirms that pent-up buyer demand is real, funded, and active. The $645.7 million in total June sales volume is up 45% from May. Active inventory is flat month-over-month at 1,320 homes, but new listings came in at only 874 for the month — 5.2% below May — meaning buyer demand is absorbing supply faster than sellers are replenishing it. The median new listing price of $799,900 sits meaningfully below both the active median ($889,000) and the sold median ($815,000), suggesting that strategic sellers are pricing below the market to generate immediate competition rather than chasing the aspirational end of the price range.
For single-family buyers:
At 16 days to contract and 102.37% list-to-sale, correctly priced homes are gone before most buyers finish their weekend showings. The 679 new pending contracts in June confirms buyers are moving decisively. The median estimated home value of $861,420 is up 6.17% year-over-year and 24.09% over three years — waiting has a documented cost of roughly $167,000 in this market over that period. The best buying strategy right now: know your comps better than the listing agent does, be pre-approved and ready to move within 48 hours, and target new listings in their first 7 days. After that, you're negotiating with the market — not the seller.
The PSA perspective on the list-price gap:
The median active list price ($889,000) is $74,000 above the median sold price ($815,000). The gap looks wide, but it's partly a composition problem: the active inventory at $889,000 includes stale, overpriced listings that haven't cleared. New listings came to market at $799,900 median — $89,100 below the stale active inventory and actually $15,100 below the cleared sold median. Those are the homes selling in 16 days at 102.4% of ask. For sellers, the lesson is precise: price to the active cleared market, not to the stale asking market. The buyers know the difference.
Mansion Tax Note: For transactions at or above $1,000,001 — common in Colts Neck, Rumson, Middletown, and other higher-price markets — New Jersey's Mansion Tax (P.L. 2025, c. 69, effective July 10, 2025) applies to sellers at a graduated rate on the entire purchase price, starting at 1.0% for sales between $1M–$2M. On the $1,910,000 Colts Neck closing in this month's sample, the seller Mansion Tax obligation would be approximately $38,200. Factor this into your net proceeds calculation before listing.
3-Year Price Trend — Single-Family Residence
Monmouth County SFR median values at multiple time horizons — Source: RPR, 6/30/2026
| Metric | Current (Jun 2026) | 12 Months Ago | Change | 36 Months Ago | Change |
|---|---|---|---|---|---|
| Median Est. Home Value | $861,420 | $811,340 | +6.17% | $694,210 | +24.09% |
| Median Sold Price | $815,000 | $770,000 | +5.84% | $680,500 | +19.76% |
| Median Sold Price (24-month) | $815,000 | $749,000 | +8.81% | — | — |
Source: Realtors Property Resource (RPR), June 30, 2026. Estimated values are model-generated, not formal appraisals.
Monthly Sales Activity — Single-Family (Last 12 Months)
Active listing inventory vs. closed sales volume, Monmouth County SFR. Source: RPR MLS data, 6/30/2026.
| Month | Active Listings | Closed Sales | Month | Active Listings | Closed Sales |
|---|---|---|---|---|---|
| Jul 2025 | ~1,470 | 556 | Jan 2026 | ~1,010 | 356 |
| Aug 2025 | ~1,470 | 526 | Feb 2026 | ~960 | 288 |
| Sep 2025 | ~1,470 | 569 | Mar 2026 | ~1,130 | 366 |
| Oct 2025 | ~1,420 | 563 | Apr 2026 | ~1,240 | 362 |
| Nov 2025 | ~1,250 | 431 | May 2026 | ~1,320 | 447 |
| Dec 2025 | ~1,060 | 534 | Jun 2026 | ~1,320 | 595 |
Active listing counts are end-of-month snapshots. Closed sales figures sourced from RPR bar chart data and may be subject to revision as transactions finalize.
Sample of Closed Single-Family Transactions — July 2026
Median closed price from this sample: $1,000,000. Median $/sqft: $408. (Sample of 10 skews toward higher-priced properties; countywide June median sold price is $815,000.)
| Property | Closed Price | $/sqft | Sqft | DOM | List:Sale / Note |
|---|---|---|---|---|---|
| 2 Beaver St, Hazlet 4/2 • 1,548 sqft • Built 1960 |
$595,000 | $384 | 1,548 | 28 | ↓ 3.49% — priced slightly above market |
| 11 Benet Dr, Morganville 4/3 • 2,292 sqft • Built 1967 |
$850,000 | $371 | 2,292 | 6 | No ratio — moved in 6 days, strong demand |
| 54 Bluefield Rd, Lincroft 4/4 • 4,287 sqft • Built 1979 |
$1,365,000 | $318 | 4,287 | 30 | ↓ 0.73% — large luxury home, competitive result |
| 121 Brittany Dr, Freehold 5/3 • 2,406 sqft • Built 1970 |
$875,000 | $364 | 2,406 | 7 | ↑ 6.06% — over ask, 7 days |
| 85 Clover Hill Rd, Colts Neck 4/5 • 4,460 sqft • Built 2004 |
$1,910,000 | $428 | 4,460 | 11 | ↑ 9.14% — Colts Neck luxury, over ask |
| 9 Embury Ave, Ocean Grove 2/3 • 1,196 sqft • Built 1872 |
$1,125,000 | $941 | 1,196 | 225 | ↓ 6.17% — historic cottage, extended market time |
| 20 Gina Dr, Allentown 5/4 • 4,154 sqft • Built 2017 |
$1,455,101 | $350 | 4,154 | 10 | ↑ 7.79% — newer construction, over ask |
| 190 Kentucky Way, Freehold 3/3 • 2,010 sqft • Built 1996 |
$800,000 | $398 | 2,010 | 18 | ↑ 6.67% — over ask, 18 days |
| 12 Kilmer Ct, Freehold 2/3 • 1,220 sqft • Built 1987 |
$470,000 | $385 | 1,220 | 15 | No ratio — entry-level strong value play |
| 10 Lakeside Ave, Rumson 3/2 • 1,213 sqft • Built 1952 |
$1,175,000 | $969 | 1,213 | 7 | ↑ 18.09% — best list:sale in report, waterfront premium |
Source: RPR / MLS. Closed dates July 10, 2026. List:Sale ratio calculated where available. $/sqft based on living area reported in MLS.
Frequently Asked Questions
What is the median single-family home price in Monmouth County right now?
The median sold price for a single-family home in Monmouth County as of June 2026 is $815,000 — up 1.88% from May and 5.84% year-over-year. The median estimated home value countywide is $861,420. Note that all-property figures (including condos and townhomes) show a lower blended median; single-family homes command a meaningful premium in this market.
How long does it take to sell a single-family home in Monmouth County?
Single-family homes in Monmouth County are selling in a median of 16 days as of June 2026, down 11.1% from the prior month. Correctly priced homes move faster: a Morganville home closed in 6 days, Freehold and Rumson closings in 7 days, and Colts Neck in 11 days — all at or above the asking price. Properties that sit beyond 30–45 days typically have one thing in common: they launched overpriced.
Are single-family homes in Monmouth County selling over asking price?
Yes. The list-to-sale ratio for single-family homes in June 2026 is 102.37%, meaning closed homes are selling above their asking price on average. Of the 10 sampled July closings, 6 sold above ask — led by a Rumson waterfront at 118.09% of list in 7 days, Colts Neck at 109.14%, and Freehold homes at 106.06% and 106.67%. Three sold below ask, all with extended days on market or condition factors.
Is it a seller's or buyer's market for single-family homes in Monmouth County?
It is a seller's market. With 2.57 months of supply (anything below 3 months favors sellers), a 102.37% list-to-sale ratio, and homes selling in a median of 16 days, single-family sellers in Monmouth County hold clear leverage. June's 595 closings — the highest monthly volume in over a year — confirms that buyer demand is strong and well-funded heading into summer. Inventory has risen from winter lows but remains well below balanced-market levels.
How much have single-family home values increased in Monmouth County?
Monmouth County single-family home values have appreciated 6.17% year-over-year and 24.09% over the past three years as of June 2026. In dollar terms, the median estimated value has risen from $694,210 three years ago to $861,420 today — a gain of approximately $167,210. The median sold price has increased from $680,500 to $815,000 over the same period, a gain of roughly $134,500.
What is a good price per square foot for a single-family home in Monmouth County?
Based on June 2026 closed transactions, the median price per square foot for single-family homes in Monmouth County is approximately $408. However, $/sqft ranges widely: oceanside and waterfront homes commanded $941–$969/sqft (Ocean Grove, Rumson), while larger inland homes ranged from $318–$398/sqft. Price per square foot is a useful benchmark but should never be the primary basis for pricing or offers — location, condition, and lot size drive most of the variance.
What is the housing market like in Monmouth County in summer 2026?
Monmouth County's single-family housing market in summer 2026 is defined by accelerating demand, limited supply, and sustained appreciation. June 2026 posted 595 closings — the strongest monthly sales volume in over a year — while active inventory held flat at 1,320 homes. The median sold price of $815,000 is up 24.09% over three years. Homes are selling in 16 days at 102.4% of the asking price. Sellers who price accurately relative to recent closed comps are collecting offers in the first week; those who chase the aspirational active list median are watching their homes sit.
Know What Your Home Is Worth in This Market
June's data confirms this is a precision pricing market. The gap between a correctly priced listing and an overpriced one is the difference between offers in week one and a price reduction in week five. Ryan Skove has closed over 750 transactions and $500M in Monmouth County real estate — and knows exactly where your home lands in this data.
Get My Home's Value Schedule a ConsultationRecent Posts