
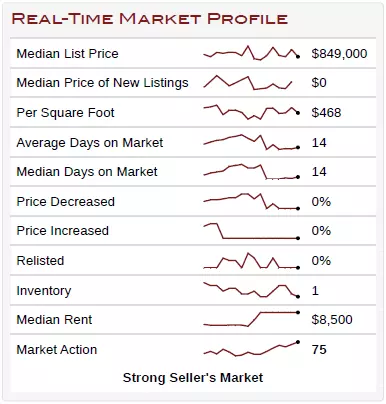
Little Silver Real Estate Market: April 2025
🔥 Little Silver Real Estate Market: April 2025 Snapshot If you’ve been wondering “How’s the market in Little Silver?” — we’ve got the answers, and the numbers are speaking loud and clear: it’s a strong seller’s market. Let’s break down the latest data and what it means for you, whether you're plann

Pending Home Sales Advanced 2.0% in February
NAR forecasts mortgage rates will average 6.4%, existing-home sales will increase by 6%, new-home sales will improve by 10% and the national median home price will rise by 3% in 2025 Key Highlights Pending home sales in February augmented 2.0%. Compared to one month ago, pending home sales declined

Existing-Home Sales Accelerated 4.2% in February
Key Highlights Existing-home sales advanced 4.2% in February to a seasonally adjusted annual rate of 4.26 million. Sales slipped 1.2% from one year ago. The median existing-home sales price rose 3.8% from February 2024 to $398,400, the 20th consecutive month of year-over-year price increases. The in
Mortgage Rates Recover After Starting Slightly Higher
Ryan Skove has shared this article with you. View | Download 30YR Fixed 6.78% -0.04% 15YR Fixed 6.23% -0.01% Mortgage Rates Recover After Starting Slightly Higher Mortgage rates hit their highest levels in just over 2 weeks yesterday and they were on track to remain unchanged today. In f

Tariffs could drive up new home prices by as much as $22,000, research finds
On Tuesday, President Donald Trump’s administration imposed new tariffs on imports from Canada and Mexico while increasing existing tariffs on goods from China, a move expected to raise prices for new homes, according to a recent CoreLogic report. That’s largely because tariffs affect essential home

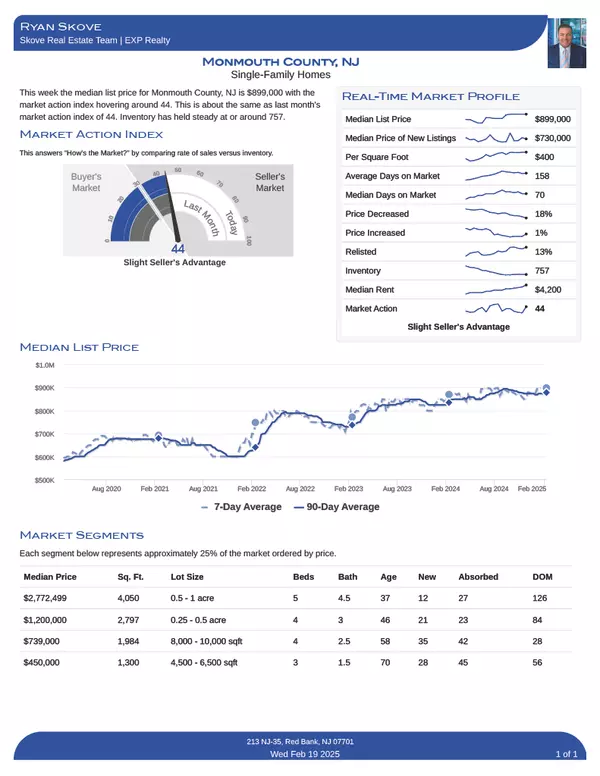
New Jersey Real Estate Market Update: Trends in Long Branch, Monmouth County, & National Construction Insights
New Jersey Real Estate Market Update: Trends in Long Branch, Monmouth County, and National Construction Insights The real estate landscape is evolving rapidly, and staying informed is essential whether you're a seller, buyer, or investor. In this blog post, we explore the latest market updates for N
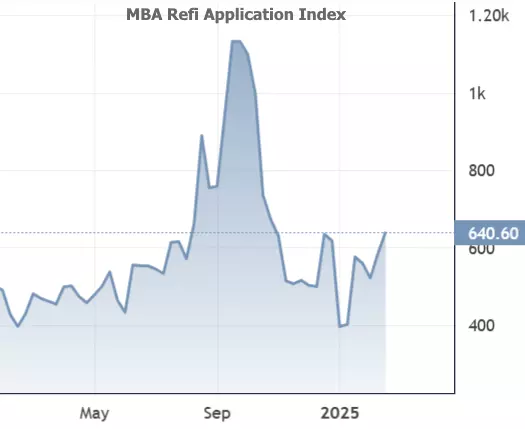
Refi Demand at 3 Month High Thanks to Lower Rates
Refi Demand at 3 Month High Thanks to Lower Rates Ryan Skove has shared this article with you. View | Download 30YR Fixed 7.03% +0.01% 15YR Fixed 6.45% -0.01% Refi Demand at 3 Month High Thanks to Lower Rates In this week's update on mortgage applications from the Mortgage Bankers Asso
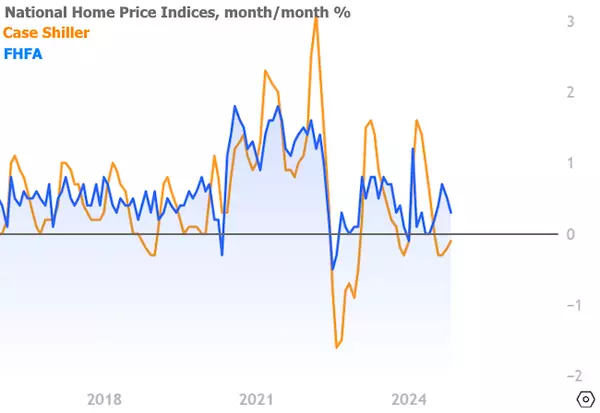
Home Price Appreciation Ran Just Above Expectations in November
Ryan Skove has shared this article with you. View | Download 30YR Fixed 7.07% +0.00% 15YR Fixed 6.49% +0.01% Home Price Appreciation Ran Just Above Expectations in November Both S&P Case-Shiller and the FHFA released national home price indices this morning. In both cases, November's pri
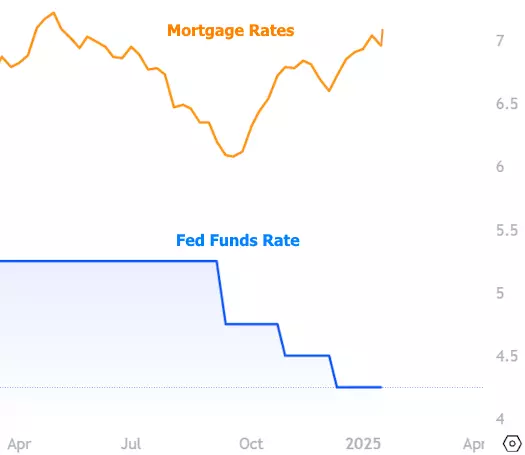
Can Trump Actually Force Rates to Move Lower?
Ryan Skove has shared this article with you. View | Download 30YR Fixed 7.07% -0.04% 15YR Fixed 6.48% -0.03% Can Trump Actually Force Rates to Move Lower? It turned out to be an intensely boring week for mortgage rates. The average lender stayed right in line with last week until moving

Existing Home Sales Inch Up to Highest Levels Since February
Ryan Skove has shared this article with you. View | Download 30YR Fixed 7.11% -0.01% 15YR Fixed 6.51% -0.01% Existing Home Sales Inch Up to Highest Levels Since February It's no mystery that 2024 hasn't been a stellar year for home sales and many other housing metrics. Today's releas

Highest Purchase Applications in a Year? Technically, Yes
Ryan Skove has shared this article with you. View | Download 30YR Fixed 7.11% -0.01% 15YR Fixed 6.51% -0.01% Highest Purchase Applications in a Year? Technically, Yes The Mortgage Bankers Association's (MBA) weekly mortgage application survey showed a modest decrease in refinance appli
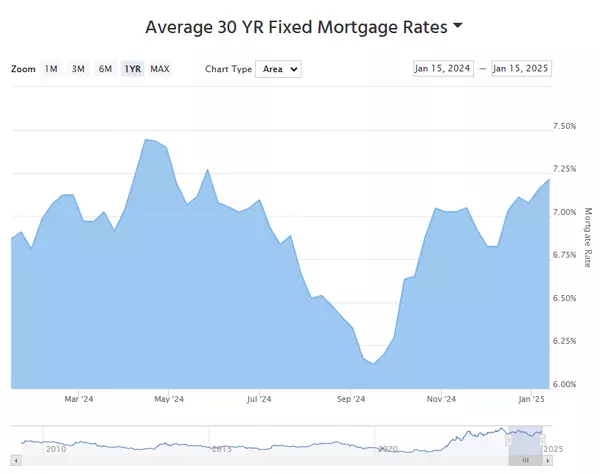
Mortgage Rate Watch - Jan 15th 2025
Ryan Skove has shared this article with you. Download PDF View on Web 30 YR Fixed 7.13% -0.12% 15 YR Fixed 6.52% -0.06% 30 YR FHA 6.55% -0.04% 30 YR Jumbo 7.40% -0.04% Mortgage Rates Make a Modest Recovery Ahead of Important Inflation Data Mortgage rates officially hit the highest levels s
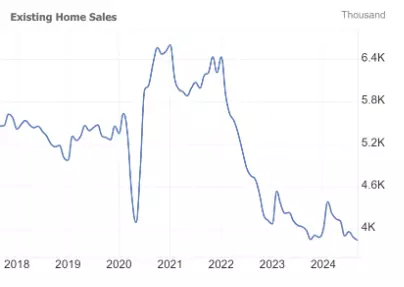
Existing Home Sales Update: Still Bad
30YR Fixed 7.09% +0.07% 15YR Fixed 6.48% -0.02% Existing Home Sales Update: Still Bad Housing was chugging right along in early 2020, then covid happened. Housing experienced lots of unexpected volatility with the most important development being a huge increase in demand and prices... at first


Why Pre-Approval Should Be at the Top of Your Homebuying To-Do List
Why Pre-Approval Should Be at the Top of Your Homebuying To-Do List Since the supply of homes for sale is growing and mortgage rates are coming down, you may be thinking it’s finally your moment to jump into the market. To make sure you’re ready, you need to get pre-approved for a mortgage. That’s w


Ryan Skove
Phone:+1(732) 222-6336