What Experts Say Will Happen with Home Prices Next Year
Experts are starting to make their 2023 home price forecasts. As they do, most agree homes will continue to gain value, just at a slower pace. Over the past couple of years, home prices have risen at an unsustainable rate, leaving many to wonder how long it would last. If you’re asking yourself: what’s ahead for the price of my home, know that experts are now answering this question, and its welcome news for homeowners who may have been led by the media to believe their home would lose value.
Historically, home prices have appreciated at a rate near 4%. For 2023, the average of six major forecasters noted below is 2.5%. While one, Zelman & Associates, is calling for depreciation, the other five are calling for appreciation. The graph below outlines each expert forecast to show where they project home prices are going in the coming year.
To understand why experts are calling for appreciation next year, look to the economics of supply and demand. Dave Ramsey, Financial Expert, says this:
“The root issue of what drives house prices almost always is supply and demand . . .”
Two things are driving home prices upward. First, the undersupply of homes on the market is an issue we continue to face in this country. We still don’t have enough homes on the market for the number of people that want to buy them. To further that point, we’re still in a sellers’ market nationally, and in that scenario, home prices tend to appreciate.
Second, millennials are moving through their peak homebuying years. Since they’re the largest demographic behind the baby boomers, demand isn’t going away any time soon.
Bottom Line
Experts are calling for home prices to appreciate next year, although at a slower pace than the previous three years. The reason for this is simple. The dynamics of supply and demand are playing out in real estate and will continue for many years to come.
Top Reasons Homeowners Are Selling Their Houses Right Now
Some people believe there’s a group of homeowners who may be reluctant to sell their houses because they don’t want to lose the historically low mortgage rate they have on their current home. You may even have the same hesitation if you’re thinking about selling your house.
Data shows 51% of homeowners have a mortgage rate under 4% as of April this year. And while it’s true mortgage rates are higher than that right now, there are other non-financial factors to consider when it comes to making a move. In other words, your mortgage rate is important, but you may have other things going on in your life that make a move essential, regardless of where rates are today. As Jessica Lautz, Vice President of Demographics and Behavioral Insights at the National Association of Realtors (NAR), explains:
“Home sellers have historically moved when something in their lives changed – a new baby, a marriage, a divorce or a new job. . . .”
So, if you’re thinking about selling your house, it may help to explore the other reasons homeowners are choosing to make a move today. The 2022 Summer Sellers Survey by realtor.com asked recent home sellers why they decided to sell. The visual below breaks down how those homeowners responded:
As the visual shows, an appetite for different features or the fact that their current home could no longer meet their needs topped the list for recent sellers. Additionally, remote work and whether or not they need a home office or are tied to a specific physical office location also factored in, as did the desire to live close to their loved ones.
The realtor.com survey summarizes the findings like this:
“The primary reason homeowners decided to sell in the last year was the realization that, after so much time spent at home, they wanted different features and amenities, such as walkability, outdoor space, pool, etc. . . . ”
If you, like the homeowners they surveyed, find yourself wanting features, space, or amenities your current home just can’t provide, it may be time to consider listing your house for sale.
Even with today’s mortgage rates, your lifestyle needs may be enough to motivate you to make a change. The best way to find out what’s right for you is to partner with a trusted real estate professional who can provide expert guidance and advice throughout the process. They can help walk you through your options, so you can make a confident decision based on what matters most to you and your loved ones.
Bottom Line
While the financial reasons for moving are important, there’s often far more to consider. Non-financial reasons can also be a significant motivating factor. If you need help weighing the pros and cons of selling your house, let’s connect today.
Will My House Still Sell in Today’s Market?
If recent headlines about the housing market cooling and buyer demand moderating have you worried you’ve missed your chance to sell, here’s what you need to know. Buyer demand hasn’t disappeared, it’s just eased from the peak intensity we saw over the past two years.
Buyer Demand Then and Now
During the pandemic, mortgage rates hit record lows, and that spurred a significant rise in buyer demand. This year, as rates increased due to factors like rising inflation, buyer demand pulled back or softened as a result. The latest data from ShowingTime confirms this trend (see graph below):
The orange bars in the graph above represent the last few months of data and the clear cooldown in the volume of home showings the market has seen since mortgage rates started to rise. But context is important. To get the full picture of where today's demand stands, let's look at the July data for the past six years (see graph below):
This second visual makes it clear that, while moderating compared to the frenzy in 2020 and 2021, showing activity is still beating pre-pandemic levels – and those pre-pandemic years were great years for the housing market. That goes to show there’s still demand if you sell your house today.
What That Means for You When You Sell
The key to selling in a changing market is understanding where the housing market is now. It’s not the same market we had last year or even earlier this year, but that doesn’t mean the opportunity to sell has passed.
While things have cooled a bit, it’s still a sellers’ market. If you work with a trusted local expert to price your house at the current market value, the demand is still there, and it should sell quickly. According to a recent survey from realtor.com, 92% of homeowners who sold in August reported being satisfied with the outcome of their sale.
Bottom Line
Buyer demand hasn’t disappeared, it’s just moderated this year. If you’re ready to sell your house today, let’s connect so you have expert insights on how the market has shifted and how to plan accordingly for your sale.
August 2022 Monthly Housing Market Trends Report
The national inventory of active listings increased by 26.6% over last year.
The total inventory of unsold homes, including pending listings, increased by just 1.3% year-over-year due to a decline in pending inventory (-21.9%).
Selling sentiment declined and listing activity followed, with newly listed homes declining by 13.4% on a year-over-year basis.
The median list price grew by 14.3% in August, a deceleration from recent highs.
Time on market was 42 days, 5 days more than last year but 22 days less than typical pre-pandemic levels.
Regionally, large Western markets which saw some of the most growth last year and earlier this year are now showing the greatest signs of deceleration, with larger inventory increases, more price reductions, and more quickly decelerating price growth than other regions.
Realtor.com®’s August housing data release reveals that listing prices decelerated for the third month in a row, as more sellers hit pause on listing homes and homes for sale spent more time on the market than last August. While fewer new listings are entering the market, overall inventory continues to grow, providing more choice to buyers who are still shopping for a home. Western markets lead other regions in increased inventory, price reductions, and deceleration of price growth. This fall, a more moderate pace of homeselling, more listings to choose from, and softening price growth will provide some breathing room for buyers searching for a home during what is typically the best time to buy a home.
Selling Sentiment Wanes but the Inventory of Homes is Still Rising
Nationally, the inventory of homes actively for sale on a typical day in August increased by 26.6% over the past year. This amounted to 164,000 more homes actively for sale on a typical day in August compared to the previous year. However, driven by a decline in seller sentiment, the inventory growth rate in August was lower than July’s historical growth rate of 30.7%, which was the largest increase in inventory in the data history.
Despite this improvement in the number of homes actively for sale, as the chart above clearly illustrates, active listings lag their pre-pandemic level and are also still slightly lower than during the first year of the pandemic. The number of active listings in August was 7.2% below 2020 and 43.8% lower than the pre-pandemic 2017-2019 average.
The total number of unsold homes nationwide—a metric that includes active listings and listings in various stages of the selling process that are not yet sold—was up 1.3% year-over-year. However, growth decelerated from last month’s 3.5% growth rate as the count of pending listings and newly listed homes fell further on a year-over-year basis.
The total inventory of homes for sale includes homes in pending status, which are those listings in various stages of the selling process that are not yet sold. The inventory of pending listings on a typical day has declined by 21.9% compared to last August. This is a further deceleration from the 19.4% annual decline we reported for July. This moderating buyer demand has been spurred by rising interest rates and listing prices close to all-time highs that have increased the cost of financing 80% of the typical home by 61% compared to a year ago.
In August, newly listed homes declined by 13.4% compared to the same time last year, a greater rate of decline compared to last month’s 2.8% year-over-year decrease. While sellers had been fueling the recent run of inventory growth with freshly listed homes, in July, seller sentiment shifted greatly. Fannie Mae’s Home Purchase Sentiment Index (HPSI) revealed that home sentiment declined in July, as the net share of respondents saying now is a good time to sell decreased by 2 percentage points compared to the previous month and by 15 percentage points compared to last year. Sellers may feel that they have missed the peak, or that it’s too difficult and expensive to buy another home at this time given the costs of financing, a concern that could affect nearly three-quarters of potential sellers per recent survey data. The HPSI survey also revealed that the net share of Americans who believe home prices will go up over the next 12 months decreased by 8 percentage points in July compared to the previous month.
The inventory of homes actively for sale in the 50 largest U.S. metros overall increased by 39.1% over last year in August, outpacing the national growth rate. However, the inventory of homes in large Northeastern metros declined by 2.4% on average compared to last year, while other regions saw growth in the number of homes for sale. In the West, active listings grew most (by +70.8% year-over-year), followed by the South (+56.3%), and Midwest (+6.5%). No regions saw new listing activity above the previous year. The South saw newly listed homes decline by 3.8% compared to the previous year, while they declined by 19.7% in the Northeast, 18.1% in the Midwest, and 14.3% in the West.
Inventory increased in 39 out of 50 of the largest metros compared to last year. Metros which saw the most inventory growth include Phoenix (+177.4%), Raleigh (+163.6%), and Austin (+138.6%), all of which experienced booming demand during the pandemic. Inventory is still declining on a year-over-year basis in 11 markets including Hartford (-24.4%), Milwaukee (-11.8%), and Chicago (-11.7%). Milwaukee and Chicago also made our list of most improved large markets in our Market Hotness Rankings.
Only 8 of the 50 largest metros also saw the number of newly listed homes increase compared to last year, down from 12 in July. The markets which saw the highest year-over-year growth in newly listed homes included Nashville (+25.5%), Raleigh (+14.4%) and Las Vegas (+13.1%). Markets which are seeing large declines in newly listed homes compared to last year include San Jose (-29.3%), Baltimore (-28.3%), and Washington, DC (-27.0%).
Time on Market Grows for the First time Since 2020
The typical home spent 42 days on the market this August which is five days more than last year and the first month that time on market increased since June 2020, during the early days of the pandemic. While new listing activity has declined, the inventory of homes for sale continues to increase as homes spend slightly longer on the market compared to last year. Nonetheless, homes still spent 22 fewer days on the market this August than typical 2017 to 2019 timing.
In the 50 largest U.S. metros, the typical home spent 37 days on the market, five days more than last August. Time on market increased similarly across regions, with larger metros in the West seeing the greatest increase (+7 days), followed by the South and Midwest (+4 days) and the Northeast (+3 days).
Forty-eight of the 50 largest metros saw time on market increase compared to the previous year. Time on market only declined in Miami, by 9 days compared to last year, and in Richmond, by 1 day. Time on market increased most in the southern and western metros of Austin (+16 days), Raleigh (+12 days), and Riverside (+11 days).
Price Growth Softens but Homes Are Still More Expensive than Last Year
The median national home price for active listings declined to $435,000 in August, down from an all-time high of $450,000 in June. This represents an annual growth rate of 14.3%, a deceleration from last month’s growth rate of 16.6%. In addition, the 3.1% drop in the median listing price compared to July is also the largest July-to-August drop in the median listing price in our records (dating back to 2016).
Until recently, the median listing price has been buoyed by slow adjustments to seller expectations as well as a shift in the mix of inventory which saw 57% of active listings comprise of larger (1750 sqft+) homes compared to just 54% last August. However, controlling for home size, the median listing price per square foot grew by 13.2% year-over-year, down from a growth rate of 15.5% in July, further signaling a moderation in price growth ahead.
In addition, the median list price of listings in pending status–those homes for which the seller has already accepted a buyer’s offer to purchase–also decelerated, from a year-over-year rate of 12.4% in July to a growth rate of 11.9% in August. This is the fourth consecutive month of pending listing price deceleration and its lower growth rate compared to the overall median listing price indicates that the homes which buyers are choosing to buy are becoming increasingly less expensive than the typical listed home.
The share of homes having their price reduced increased from 11.0% last August to 19.4% this year and is close to typical 2017 to 2019 levels. While price reductions have increased significantly compared to last year, as a share of inventory they were above August 2019 (17.9% of inventory) and still slightly below 2018 (21.3%) and 2017 (19.5%).
Active listing prices in the nation’s largest metros grew by an average of 10.9% compared to last year, decelerating from 12.0% last month. Southern metros led the charge in active listing price growth, growing by 13.5% on average over the past year. The southern metros of Miami (+33.4%), Memphis (+25.8%), posted the highest year-over-year median list price growth in August, followed by Milwaukee (+25.0%). Milwaukee also ranked as the most improved large market in our Market Hotness Rankings. Large western metros, while not the lowest ranking for price growth, have seen the greatest price deceleration since this spring. Western metros had the largest average growth rate of 16.6% in April, and have since fallen to tie the Northeast for third place among regions with a growth rate of 7.9%. Large western metros also saw the greatest increase in the share of price reductions (+16.2 percentage points), followed by southern metros (+10.4 percentage points). No western metros made our list of hottest markets in August, the first time this has happened in August in our data’s history. Homes in Phoenix (+30.9 percentage points), Austin (+24.8 percentage points), and Las Vegas (+24.4 percentage points) showed the greatest growth in the share of homes with price reductions compared to last year.
August 2022 Regional Statistics (50 Largest Metro Combined Average)
Region
Active Listing Count YoY
New Listing Count YoY
Median Listing Price YoY
Median Listing Price Per SF YoY
Median Days on Market Y-Y (Days)
Price Reduced Share Y-Y (Percentage Points)
Midwest
6.5%
-18.1%
11.3%
8.6%
+ 4 days
+4.2 pp
Northeast
-2.4%
-19.7%
7.9%
4.4%
+3 days
+2.7 pp
South
56.3%
-3.8%
13.5%
12.0%
+4 days
+10.4 pp
West
70.8%
-14.3%
7.9%
7.7%
+7 days
+16.2 pp
August 2022 Housing Overview by Top 50 Largest Metros
Metro
Median Listing Price
Median Listing Price YoY
Median Listing Price per Sq. Ft. YoY
Active Listing Count YoY
New Listing Count YoY
Median Days on Market
Median Days on Market Y-Y (Days)
Price Reduced Share
Price Reduced Share Y-Y (Percentage Points)
Atlanta-Sandy Springs-Roswell, Ga.
$425,000
7.3%
9.0%
48.7%
-5.8%
35
1
22.0%
12.8 pp
Austin-Round Rock, Texas
$575,000
6.0%
7.5%
138.6%
-2.0%
39
16
41.5%
24.8 pp
Baltimore-Columbia-Towson, Md.
$352,000
5.2%
4.6%
-3.2%
-28.3%
37
3
16.7%
3.7 pp
Birmingham-Hoover, Ala.
$284,000
4.2%
10.3%
27.3%
-11.2%
42
5
17.2%
9.2 pp
Boston-Cambridge-Newton, Mass.-N.H.
$729,000
12.2%
4.2%
4.5%
-22.4%
35
4
17.1%
4.6 pp
Buffalo-Cheektowaga-Niagara Falls, N.Y.
$247,000
6.6%
6.7%
11.2%
-13.1%
37
6
9.3%
1.9 pp
Charlotte-Concord-Gastonia, N.C.-S.C.
$425,000
10.3%
12.6%
64.3%
11.4%
37
9
19.9%
7.6 pp
Chicago-Naperville-Elgin, Ill.-Ind.-Wis.
$350,000
2.6%
1.9%
-11.7%
-24.4%
36
1
15.4%
2.2 pp
Cincinnati, Ohio-Ky.-Ind.
$325,000
1.6%
5.8%
-7.0%
-21.4%
34
3
13.8%
3.2 pp
Cleveland-Elyria, Ohio
$225,000
12.5%
8.7%
4.9%
-14.1%
41
2
16.6%
3.5 pp
Columbus, Ohio
$336,000
12.0%
11.0%
11.1%
-15.2%
29
8
19.4%
6.2 pp
Dallas-Fort Worth-Arlington, Texas
$461,000
16.7%
13.6%
80.7%
5.4%
36
5
26.3%
14 pp
Denver-Aurora-Lakewood, Colo.
$637,000
6.2%
2.1%
71.6%
-13.4%
30
9
31.3%
18.7 pp
Detroit-Warren-Dearborn, Mich.
$275,000
2.6%
3.4%
25.5%
-10.0%
33
9
24.3%
7.3 pp
Hartford-West Hartford-East Hartford, Conn.
$377,000
14.2%
3.9%
-24.4%
-24.1%
37
4
9.4%
0.4 pp
Houston-The Woodlands-Sugar Land, Texas
$383,000
5.3%
8.2%
23.2%
-1.4%
38
1
21.4%
7.3 pp
Indianapolis-Carmel-Anderson, Ind.
$313,000
12.0%
12.6%
39.6%
-9.3%
37
1
20.5%
9 pp
Jacksonville, Fla.
$429,000
19.5%
17.7%
75.1%
-4.7%
41
3
23.2%
13.1 pp
Kansas City, Mo.-Kan.
$387,000
20.2%
13.5%
29.5%
-17.1%
46
7
14.3%
4.2 pp
Las Vegas-Henderson-Paradise, Nev.
$470,000
11.3%
15.1%
93.4%
13.1%
37
11
41.3%
24.4 pp
Los Angeles-Long Beach-Anaheim, Calif.
$938,000
4.3%
5.1%
37.9%
-17.5%
37
4
19.4%
10.9 pp
Louisville/Jefferson County, Ky.-Ind.
$299,000
12.9%
7.9%
15.5%
-17.8%
32
6
19.8%
6.2 pp
Memphis, Tenn.-Miss.-Ark.
$313,000
25.8%
22.2%
55.5%
-7.4%
39
2
16.4%
9.3 pp
Miami-Fort Lauderdale-West Palm Beach, Fla.
$617,000
33.4%
18.9%
8.6%
-6.1%
50
-9
14.8%
7.4 pp
Milwaukee-Waukesha-West Allis, Wis.
$362,000
25.0%
13.3%
-11.8%
-26.9%
36
1
13.8%
-1.1 pp
Minneapolis-St. Paul-Bloomington, Minn.-Wis.
$420,000
18.3%
8.4%
-5.1%
-22.7%
37
8
16.8%
5.8 pp
Nashville-Davidson–Murfreesboro–Franklin, Tenn.
$533,000
21.2%
13.1%
129.2%
25.5%
28
10
27.4%
15.7 pp
New Orleans-Metairie, La.
$334,000
-1.8%
1.5%
24.4%
-14.8%
49
4
22.9%
9.3 pp
New York-Newark-Jersey City, N.Y.-N.J.-Pa.
$637,000
6.3%
3.1%
-9.4%
-20.4%
54
2
10.3%
1.4 pp
Oklahoma City, Okla.
$320,000
14.1%
16.1%
40.7%
8.7%
41
5
18.6%
6.3 pp
Orlando-Kissimmee-Sanford, Fla.
$454,000
21.1%
19.3%
74.0%
-3.1%
40
3
22.0%
11.4 pp
Philadelphia-Camden-Wilmington, Pa.-N.J.-Del.-Md.
$339,000
6.1%
7.1%
-1.8%
-22.2%
46
3
14.5%
2.9 pp
Phoenix-Mesa-Scottsdale, Ariz.
$500,000
5.3%
11.2%
177.4%
-6.4%
38
8
42.7%
30.9 pp
Pittsburgh, Pa.
$236,000
1.4%
0.5%
1.5%
-17.3%
44
2
19.0%
4.7 pp
Portland-Vancouver-Hillsboro, Ore.-Wash.
$595,000
7.1%
6.6%
51.3%
-18.2%
37
3
29.0%
13 pp
Providence-Warwick, R.I.-Mass.
$475,000
10.9%
8.5%
0.3%
-20.5%
33
2
12.0%
3.8 pp
Raleigh, N.C.
$487,000
15.2%
12.6%
163.6%
14.4%
30
12
23.9%
16.7 pp
Richmond, Va.
$385,000
10.0%
9.3%
2.7%
-22.9%
37
-1
11.3%
3.6 pp
Riverside-San Bernardino-Ontario, Calif.
$587,000
8.2%
10.6%
75.6%
-16.0%
42
11
23.4%
14.7 pp
Rochester, N.Y.
$225,000
-1.7%
5.2%
-4.6%
-12.8%
23
5
11.6%
0.2 pp
Sacramento–Roseville–Arden-Arcade, Calif.
$615,000
4.4%
5.1%
63.0%
-14.2%
36
8
29.7%
17.3 pp
San Antonio-New Braunfels, Texas
$375,000
7.1%
9.3%
66.5%
1.6%
39
5
22.4%
10.1 pp
San Diego-Carlsbad, Calif.
$897,000
9.5%
10.5%
45.8%
-20.3%
32
4
23.6%
13.8 pp
San Francisco-Oakland-Hayward, Calif.
$1,049,000
5.4%
4.8%
40.4%
-19.7%
35
7
17.7%
10 pp
San Jose-Sunnyvale-Santa Clara, Calif.
$1,372,000
9.7%
5.4%
31.1%
-29.3%
36
6
18.4%
11 pp
Seattle-Tacoma-Bellevue, Wash.
$777,000
15.1%
8.7%
91.4%
-14.8%
34
5
21.9%
13.6 pp
St. Louis, Mo.-Ill.
$279,000
11.8%
8.9%
-2.2%
-15.6%
44
3
14.6%
3.6 pp
Tampa-St. Petersburg-Clearwater, Fla.
$437,000
21.6%
15.5%
101.0%
0.4%
37
3
27.8%
16.8 pp
Virginia Beach-Norfolk-Newport News, Va.-N.C.
$359,000
15.6%
10.4%
-10.3%
-18.3%
29
3
17.1%
3.4 pp
Washington-Arlington-Alexandria, DC-Va.-Md.-W. Va.
$573,000
13.2%
2.9%
1.5%
-27.0%
36
3
17.5%
4.8 pp
Buyers Are Regaining Some of Their Negotiation Power
If you're thinking about buying a home today, there's welcome news. Even though it’s still a sellers’ market, it’s a more moderate sellers’ market than last year. And the days of feeling like you may need to waive contingencies or pay drastically over asking price to get your offer considered may be coming to a close.
Today, you should have less competition and more negotiating power as a buyer. That’s because the intensity of buyer demand and bidding wars is easing this year. So, if bidding wars were the biggest factor that had you sitting on the sidelines, here are two trends that may be just what you need to re-enter the market.
1. The Return of Contingencies
Over the last two years, more buyers were willing to skip important steps in the homebuying process, like the appraisal or inspection, to try to win a bidding war. But now, fewer people are waiving the inspection and appraisal.
The latest data from the National Association of Realtors (NAR) shows the percentage of buyers waiving their home inspection and appraisal is declining. And a recent survey from realtor.com confirms more sellers are accepting offers that include these conditions today. According to their August study:
95% of sellers reported buyers requested a home inspection
67% of sellers negotiated with buyers on repairs as a result of the inspection findings
This goes to show buyers are more able to include these conditions in their offers today and negotiate as needed based on the outcome of the inspection.
2. Sellers Are More Willing To Help with Closing Costs
Generally, closing costs range between 2% and 5% of the purchase price for the home. Before the pandemic, it was a common negotiation tactic for sellers to cover some of the buyer’s closing costs to sweeten the deal. This didn't happen as much during the peak buyer frenzy over the past two years.
Today, as the market shifts and demand slows, data from realtor.com suggests this is making a comeback. A recent article shows 32% of sellers paid some or all of their buyer’s closing costs. This may be a negotiation tool you’ll see as you go to purchase a home. Just keep in mind, limits on closing cost credits are set by your lender and can vary by state and loan type. Work closely with your loan advisor to understand how much a seller can contribute to closing costs in your area.
Bottom Line
Regardless of the extremely competitive housing market of the past several years, today’s data suggests negotiations are starting to come back on the table. This is good news if you're planning to enter the housing market. To find out how the market is shifting in our area, let's connect.
Getting Your House Ready To Sell? Work with an Experienced Agent for Advice
In a market that’s shifting as fast as it is today, many homeowners wonder what, if anything, needs to be renovated before they sell their house. That’s where a trusted real estate professional comes in. They can help you think through today’s market conditions and how they impact what you should – and shouldn’t – do before selling your house.
Here are some considerations a professional will guide you through.
What You Need To Know About Your Local Market
Since the supply of homes for sale has increased so much this year, today’s buyers have more options than they had last year. That may mean you’re not able to ignore some of those repairs or cosmetic updates you could have skipped in previous months. As a recent article from realtor.com says:
“To stand out in the market, sellers should make their home attractive to buyers, which usually means some selective updates.”
The key word here is selective. Since it’s still a sellers’ market, focusing on a few key areas may be enough to make your house stand out from other options. And since inventory is still low overall, it’s also possible buyers may be willing to handle the renovations themselves once they move in. It all depends on buyer demand and the available inventory in your local area. For advice on what’s happening in your market and what to do to make your house show well, lean on a professional.
Not All Renovation Projects Are Equal
In addition to making sure your house makes a good first impression, you’ll also want to consider the return on your investment (ROI) for any renovations. According to the 2022 Remodeling Impact Report from the National Association of Realtors (NAR), here are the projects that could net you the best return when you sell your house (see visual below):
Again, your real estate advisor is your best resource. When your agent comes to your house for a walk-thru and consultation, they’ll use their expertise to offer any insight into what you may need to repair, replace, or refinish. They also know what other sellers are doing before listing their homes and how buyers are reacting to those upgrades to help steer you in the right direction. As Dr. Jessica Lautz, Vice President of Demographics and Behavioral Insights for NAR, explains:
“This year, the winner was hardwood flooring. Hardwood floor refinishing and putting in new wood flooring had the most significant value, . . .”
How To Draw Buyer Attention to the Upgrades You’ve Made
For any projects you’ve already completed or for those you plan to do before listing, make sure your real estate professional knows. They’re not just an advisor to help you decide where to focus your efforts, they’re also skilled at highlighting any upgrades in your listing. That way, potential buyers know about the features that may help sell them on the house.
No matter what, contact a local real estate professional for expert advice on what work needs to be done and how to make it as appealing as possible to future buyers. Every home is different, so a conversation with your agent is mission-critical to make sure you make the right moves when selling this season.
Bottom Line
In today’s shifting market, it’s important to spend your time and money wisely when you’re getting ready to move. Let’s connect to find out where to focus your efforts before you sell.
Mortgage App Volume Declines, But Jobs Data Offers Silver Lining
The Mortgage Bankers Association (MBA)says the pace of mortgage applications slowed fora fourth consecutive time during the week ended September 2. MBA’sseasonally adjustedMarket Composite Index, a measure of application volume, decreased 0.8 percent headinginto the long Labor Day holiday weekend. On an unadjusted basis, the Index decreased by 2percent compared to the prior week.The Refinance Index dipped another 1 percent, putting it 83 percent lower than during thesame week in 2021. The refinance share of mortgage activity increased to 30.7 percent oftotal applications from 30.3 percent the previous week. At this point last year, refinancingmade up 66.8 percent of the total application volume.
“Mortgage rates moved higher over the course of last week as markets continued to re-assess the prospects for the economy and the path of monetary policy, with expectations for short-term rates to move and stay higher for longer,” said Mike Fratantoni, MBA Senior Vice President and Chief Economist. “With the 30-year fixed rate rising to the highest level since mid-June, application volumes for both purchase and refinance loans dropped. Recent economic data will likely prevent any significant decline in mortgage rates in the near term, but the strong job market depicted in the August data should support housing demand. There is no sign of a rebound in purchase applications yet, but the robust job market and an increase in housing inventories should lead to an eventual increase in purchase activity.”Highlights from MBA’s Weekly Mortgage Applications Survey:
The FHA share of total applications rose to 13.3 percent from 13.0 percent while the VA share ticked down from 11.1to 10.8 percent. The USDA share was unchanged from the prior week at 0.6 percent.
The average price of a loan moved declined from $368,900 to $367600 while the purchase loan size rose to $411,300from $409,100.
The average contract interest rate for conforming 30-year fixed-rate mortgages(FRM) increased to 5.94 percent from 5.80 percent, with points increasing to 0.79 from 0.71.
The jumbo 30-year FRM jumbo loan had an average rate of 5.46 percent with 0.40 point. The prior week the rate was 5.32 percent with 0.48 point.
The rate for 30-year FRM backed by the FHA moved 4 basis points higher, to 5.61 percent. Points averaged 1.06, downfrom 1.09.
There was a 13-basis point jump in the rate for 15-year FRM with points averaging 0.86.
The adjustable-rate mortgage (ARM)share of activity was unchanged at 8.5 percent of total applications while theaverage rate for 5/1 ARMs increased to 4.81 percent from 4.78 percent. Points averaged 0.88, up from 0.61 a weekearlier.
Expert Forecasts on Mortgage Rates %
Expert Forecasts on Mortgage Rates
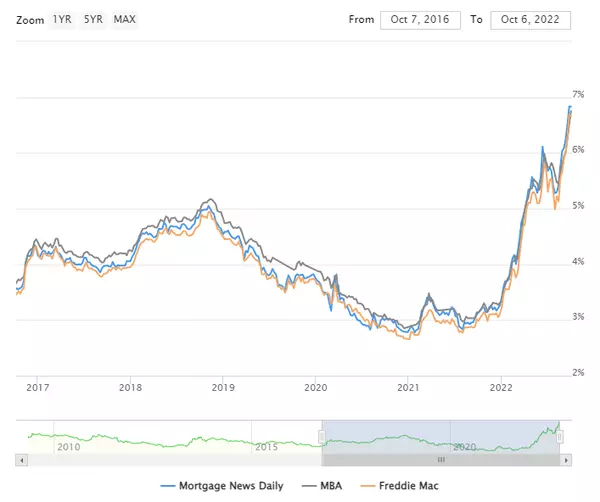
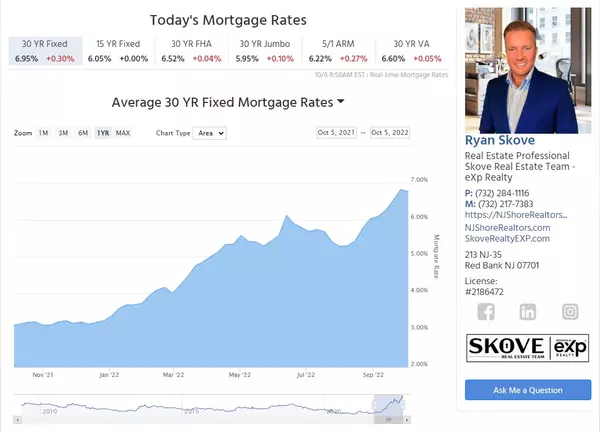
If you’ve been thinking of buying a home, you may have been watching what’s happened with mortgage rates over the past year. It’s true they’ve risen dramatically, but where will they go from here, especially as the market continues to slow?
As you think about your homeownership goals and decide if now’s the time to make your move, the best place to turn to for that information is the professionals. Here’s a summary of the latest mortgage rate forecasts from housing market experts.
Experts Project Mortgage Rates Will Stabilize
While mortgage rates continue to fluctuate due to ongoing inflationary pressures and economic uncertainty, experts project they’ll start to stabilize in the months ahead. According to the latest projections, mortgage rates are expected to hover in the low to mid 5% range initially, and then potentially dip into the high 4% range by later next year (see chart below):
That could bring you some welcome relief. So far this year, mortgage rates have climbed over 2% due to the Federal Reserve’s response to inflation, and that’s made it more expensive to buy a home. And wondering if the rise in rates will continue is keeping some prospective buyers on the sidelines.
But now that experts say mortgage rates should stabilize, this gives you a bit more certainty about what they think the future holds, and that may help you feel more confident about your decision to buy a home.
Bottom Line
Whether you’re looking to buy your first home, move up to a larger home, or even downsize, you need to know what’s happening in the housing market so you can make the most informed decision possible. Let’s connect to discuss your goals and determine the best plan for your move.
How Owning a Home Builds Your Net Worth
Owning a home is a major financial milestone and an achievement to take pride in. One major reason: the equity you build as a homeowner gives your net worth a big boost. And with high inflation right now, the link between owning your home and building your wealth is especially important.
If you’re looking to increase your financial security, here’s why now could be a good time to start on your journey toward homeownership.
Owning a Home Is a Key Ingredient for Financial Success
A report from the National Association of Realtors (NAR) details several homeownership trends, including a significant gap in net worth between homeowners and renters. It finds:
“. . . the net worth of a homeowner was about $300,000 while that of a renter’s was $8,000 in 2021.”
To put that into perspective, the average homeowner’s net worth is roughly 40 times that of a renter’s. This difference shows owning a home is a key step in achieving financial success.
Equity Gains Can Substantially Boost a Homeowner’s Net Worth
The net worth gap between owners and renters exists in large part because homeowners build equity. When you own a home, your equity grows as your home appreciates in value and you make your mortgage payments each month. As a renter, you don’t have that same opportunity. A recent article from CNET explains:
“Homeownership is still considered one of the most reliable ways to build wealth. When you make monthly mortgage payments, you're building equity in your home . . . When you rent, you aren't investing in your financial future the same way you are when you're paying off a mortgage.”
But on top of that, your home equity grows even more as your home appreciates in value over time. That has a major impact on the wealth you build, as a recent article from Bankrate notes:
“Building home equity can help you increase your wealth over time, . . . A home is one of the only assets that have the potential to appreciate in value as you pay it down.”
In other words, when you own your home, you have the advantage of your mortgage payment acting as a contribution to a forced savings account that grows in value as your home does. And when you sell, any equity you’ve built up comes back to you. As a renter, you’ll never see a return on the money you pay out in rent every month.
Bottom Line
Owning a home is an important part of building your net worth. If you’re ready to start on your journey to homeownership, let’s connect today.
A Trusted Real Estate Advisor Provides Expert Advice
If you’re a homeowner or are planning to become one soon, you’re probably looking for clear information about today’s housing market. And if you’ve turned to the news or even just read headlines recently, you might feel like you’re left with more questions than answers. The best way to make sure you get what you need is to work with an expert.
Why You Want To Lean on a Trusted Professional
With any big milestone in life, it’s wise to seek advice from people who are experts in their field. While you likely want that advice to be perfect, perfect simply isn’t possible. But professionals have the knowledge and experience to be able to provide you with the best advice for your situation.
For example, let’s say you need an attorney, so you seek out an expert in the type of law required for your case. They won’t immediately tell you how the case is going to end or how the judge or jury will rule. But what a good attorney can do is discuss the most effective strategies based on their experience and help you put a plan together. They’ll even use their knowledge to work with you to adjust as new information becomes available.
Similarly, the job of a trusted real estate professional is to give you the best advice they can. Just like you can’t find a lawyer to give you perfect advice, you won’t find a real estate professional who can either. That’s because it’s impossible to know exactly what’s going to happen throughout your transaction. But an expert real estate advisor knows market trends and the ins and outs of the homebuying and selling processes.
They’ll use that knowledge to explain both the national headlines and what’s happening in your local area. That way, you have the best of both worlds and can feel confident in your decision to buy or sell. Freddie Mac explains why having an expert on your side is so essential:
“The success of your homebuying journey largely depends on the company you keep. . . . Be sure to select experienced, trusted professionals who will help you make informed decisions and avoid any pitfalls.”
With their expertise, a real estate advisor can anticipate what could happen next and work with you to put together a solid plan. Then, they’ll guide you through the process, helping you make decisions along the way. That’s the very definition of getting the best – not perfect – advice. And that’s the power of working with a real estate advisor.
Bottom Line
To get expert advice when you buy or sell a home this year, let’s connect today.
Why You May Want To Start Your Home Search Today
If you’re thinking about buying a home, you likely have a lot of factors on your mind. You’re weighing your own needs against higher mortgage rates, today’s home prices, and more to try to decide if you want to jump into the market. While some buyers may wait things out, there’s a reason serious buyers are making moves right now, and that’s the growing number of homes for sale.
So far this year, housing inventory has been increasing and that’s making the prospect of finding your dream home less difficult. While there are always reasons you could delay making a big decision, there are also always reasons to consider moving forward. And having a growing number of options for your home search may be exactly what you needed to feel more confident in making a move.
What’s Causing Housing Inventory To Grow?
As new data comes out, we're getting an updated picture of why housing supply is increasing so much this year. As Bill McBride, Author of Calculated Risk, explains:
“We are seeing a significant change in inventory, but no pickup in new listings. Most of the increase in inventory so far has been due to softer demand - likely because of higher mortgage rates.”
Basically, the inventory growth is primarily from homes staying on the market a bit longer (known as active listings). And that’s happening because higher mortgage rates and home prices have helped moderate the peak frenzy of buyer demand.
The graph below uses data from realtor.com to show how much active listings have risen over the past five months as a result (shown in green):
Why This Growth Is Good News for You
Regardless of the source, the increase in available housing supply is good for buyers. More housing supply actively for sale means you have more options as your search for your next home. A recent article from realtor.com explains just how significant the inventory growth has been and why it’s good news for your plans to buy:
“Nationally, the inventory of homes actively for sale on a typical day in July increased by 30.7% over the past year, the largest increase in inventory in the data history and higher than last month’s growth rate of 18.7% which was itself record-breaking. This amounted to 176,000 more homes actively for sale on a typical day in July compared to the previous year and more choice for buyers who are still looking for a new home.”
The growth this year is certainly good news for you, especially if you’ve had trouble finding a home that meets your needs. If you start your search today, those additional options should make it less difficult to find a home than it would have been over the past two years.
Bottom Line
If you’re ready to jump into the market and take advantage of the increasing supply of homes for sale, let’s connect today. The opportunity is knocking, will you answer?
3 Tips for Buying a Home Today
If you put off your home search at any point over the past two years, you may want to consider picking it back up based on today’s housing market conditions. Recent data shows the supply of homes for sale is increasing, giving buyers like you additional options.
But it’s important to keep in mind that while inventory is improving, it’s still a sellers’ market. And that means you need to be prepared as you set out on your home search. Here are three tips for buying the home of your dreams today.
1. Understand How Mortgage Rates Impact Your Homebuying Power
Mortgage rates have increased significantly this year, and over the past few weeks, they’ve been fluctuating quite a bit. It’s important to stay up to date on what’s happening with rates and understand how they can impact your purchasing power when you’re thinking of buying a home. The chart below can help.
Let’s say your budget allows for a monthly mortgage payment in the $2,100-$2,200 range. The green in the chart indicates a payment within or below that range, while the red is a payment that exceeds it.
As the chart shows, even a small change in mortgage rates can have a big impact on your monthly payments. If rates rise, you could exceed your budget unless you pursue a lower home loan amount. If rates fall, your purchasing power may increase, which could give you additional options for your search.
2. Be Open to Exploring Different Options During Your Search
The supply of homes for sale is improving, which gives you more homes to choose from. But historically, supply is still low. That means as you search for homes, if you still don’t find something that meets your needs, it may be worth expanding your search.
A recent article from the Washington Post highlights a few things buyers can consider today. It encourages opening yourself up to more areas. For example, if there’s a location you’ve previously ruled out (like a particular town, for example) it may be worth taking another look.
And if you’re able to, opening your search up to include other housing types, like newly built homes, condominiums, or townhomes can further increase your pool of options. Even as the inventory of homes for sale improves today, finding ways to cast a wider net during your search could help you find a hidden gem.
3. Work with a Local Real Estate Professional for Expert Guidance
Ultimately, you need to be prepared when you set out to buy a home. Jeff Ostrowski, Senior Mortgage Reporter for Bankrate, explains:
“Taking the leap to homeownership can provide a feeling of pride while boosting your long-term financial outlook, if you go in well-prepared and with your eyes open.”
No matter where you’re at in your homeownership journey, the best way to make sure you’re set up for success is to work with a real estate professional. If you’re just starting your search, a real estate professional can help you understand your local market and search for available homes. And when it’s time to make an offer, they’ll be an expert advisor and negotiator to help yours stand out above the rest.
Bottom Line
Strategically planning your home search by understanding today’s mortgage rates, casting a wide net, and building a team of experts can be the keys to finding the home of your dreams. To make sure you have expert advice each step of the way, let’s connect.
Planning To Retire? Your Equity Can Help You Reach Your Goal.
Whether you’ve just retired or you’re thinking about retirement, you may be considering your options and trying to picture a whole new stage of your life. And you’re not alone. Research from the Retirement Industry Trust Association (RITA) shows 10,000 Baby Boomers reach the typical retirement age (65) every day, and only 47% of the people in that generation have already retired.
If this sounds like you, one thing worth considering is whether or not your current home will suit your new lifestyle. If your home doesn’t have the features or benefits you’re looking for, the good news is, you may be in a better position to move than you realize.
That’s because, if you already own a home, you’ve likely built-up significant equity, and that can help you fuel your next move. According to the National Association of Realtors (NAR):
“A homeowner who purchased a typical home five years ago would have gained $125,300 from just price appreciation alone.”
In fact, over the last twelve months, CoreLogic reports the average homeowner in the United States gained roughly $64,000 in equity due to home price appreciation.
You can use your equity to help you achieve your homeownership goals. Whether you want to downsize, move closer to loved ones, or buy a home in a dream destination, your equity can help get you there. It may be some (if not all) of what you’d need as your down payment on a home that better fits your changing needs.
To find out how much equity to have in your home, reach out to a trusted real estate professional today.
Bottom Line
Retirement is a big step and so is buying or selling a home. As you move into this new phase of life, let's connect so you have an expert to guide you through the process as you sell your current home and give you expert advice as you buy one that’ll better suit your needs.
Experts Increase 2022 Home Price Projections
If you’re wondering if home prices are going to come down due to the cooldown in the housing market or a potential recession, here’s what you need to know. Not only are experts forecasting home prices will continue to appreciate nationwide this year, but most of them also actually increased their projections for home price appreciation from their original 2022 forecasts (shown in green in the chart below):
As the chart shows, most sources adjusted up, and now call for more appreciation in 2022 than they originally projected this January. But why are experts so confident the housing market will see ongoing appreciation? It’s because of supply and demand in most markets. As Bankrate says:
“After all, supplies of homes for sale remain near record lows. And while a jump in mortgage rates has dampened demand somewhat, demand still outpaces supply, thanks to a combination of little new construction and strong household formation by large numbers of millennials.”
Knowing that experts forecast home prices will continue to appreciate in most markets and that they’ve actually increased their original projections for this year should help you answer the question: will home prices fall? According to the latest forecasts, experts are confident prices will continue to appreciate this year, although at a more moderate rate than they did in 2021.
Bottom Line
If you’re worried home prices are going to decline, rest assured many experts raised their forecasts to say they’ll continue to appreciate in most markets this year. If you have questions about what’s happening with home prices in our local area, let's connect.
Why Experts Say the Housing Market Won't Crash
Caption
Some Highlights
Many people remember the housing crash in 2008, but experts say today’s market is fundamentally different in many ways.
First, there isn’t an oversupply of homes for sale today. Plus, lending standards are much tighter, and homeowners have record levels of equity. That means signs say there won’t be a wave of foreclosures like the last time.
If you have questions about the housing market, let’s connect.
Shifting Market a Challenge or an Opportunity for Homebuyers
Is the Shifting Market a Challenge or an Opportunity for Homebuyers?
If you tried to buy a home during the pandemic, you know the limited supply of homes for sale was a considerable challenge. It created intense bidding wars which drove home prices up as buyers competed with one another to be the winning offer.
But what was once your greatest challenge may now be your greatest opportunity. Today, data shows buyer demand is moderating in the wake of higher mortgage rates. Here are a few reasons why this shift in the housing market is good news for your homebuying plans.
The Challenge
There were many reasons for the limited number of homes on the market during the pandemic, including a history of underbuilding new homes since the market crash in 2008. As the graph below shows, housing supply is well below what the market has seen for most of the past 10 years (see graph below):
The Opportunity
But that graph also shows a trend back up in the right direction this year. That’s because moderating demand is slowing the pace of home sales and that’s one of the reasons housing supply is finally able to grow. For you, that means you’ll have more options to choose from, so it shouldn’t be as difficult to find your next home as it has been recently.
And having more options may also lead to less intense bidding wars. Data from the Realtors Confidence Index from the National Association of Realtors (NAR) shows this trend has already begun. In their recent reports, bidding wars are easing month-over-month (see graph below):
If you’ve been outbid before or you’ve struggled to find a home that meets your needs, breathe a welcome sigh of relief. The big takeaway here is you have more options and less competition today.
Just remember, while easing, data shows multiple-offer scenarios are still happening – they’re just not as intense as they were over the past year. You should still lean on an agent to guide you through the process and help you make your strongest offer up front.
Bottom Line
If you’re still looking to make a move, it may be time to pick your home search back up today. Let’s connect to kick off the homebuying process.
Why It’s Still a Sellers’ Market
As there’s more and more talk about the real estate market cooling off from the peak frenzy it saw during the pandemic, you may be questioning what that means for your plans to sell your house. If you’re thinking of making a move, you should know the market is still anything but normal.
Even though the supply of homes for sale has been growing this year, there’s still a shortage of homes on the market. And that means conditions continue to favor sellers today. That’s because the level of inventory of homes for sale can help determine if buyers or sellers are in the driver’s seat. Think of it like this:
A buyers’ market is when there are more homes for sale than buyers looking to buy. When that happens, buyers have the negotiation power because sellers are more willing to compromise so they can sell their house.
In a sellers’ market, it’s just the opposite. There are too few homes available for the number of buyers in the market and that gives the seller all the leverage. In that situation, buyers will do what they can to compete for the limited number of homes for sale.
A neutral market is when supply is balanced and there are enough homes to meet buyer demand at the current sales pace.
And for the past two years, we’ve been in a red-hot sellers’ market because inventory has been near record lows. The blue section of this graph highlights just how far below a neutral market inventory still is today.
What Does This Mean for You?
Ed Pinto, Director of the American Enterprise Institute’s Housing Center, gives a perfect summary of what’s happening in today’s market, saying:
“Overall, the best summary is that we'll move from a gangbuster sellers' market to a modest sellers' market.”
Conditions are still in your favor even though the market is cooling. If you work with an agent to price your house at market value, you’ll find success when you sell your house today. While buyer demand is softening due to higher mortgage rates, homes that are priced right are still selling fast. That means your window of opportunity to list your house hasn’t closed.
Bottom Line
Today’s housing market still favors sellers. If you’re ready to sell your house, let’s connect so you can start making your moves.
Big Data Week Brings Chance to Confirm Recent Shift
#outlook a {
padding: 0;
}
.ReadMsgBody {
width: 100%;
}
.ExternalClass {
width: 100%;
}
.ExternalClass * {
line-height: 100%;
}
body {
margin: 0;
padding: 0;
-webkit-text-size-adjust: 100%;
-ms-text-size-adjust: 100%;
}
table,
td {
border-collapse: collapse;
mso-table-lspace: 0pt;
mso-table-rspace: 0pt;
}
img {
border: 0;
height: auto;
line-height: 100%;
outline: none;
text-decoration: none;
-ms-interpolation-mode: bicubic;
}
p {
display: block;
margin: 13px 0;
}
@media only screen and (min-width:480px) {
.mj-column-per-100 {
width: 100% !important;
max-width: 100%;
}
.mj-column-per-50 {
width: 50% !important;
max-width: 50%;
}
.mj-column-per-65 {
width: 65% !important;
max-width: 65%;
}
.mj-column-per-35 {
width: 35% !important;
max-width: 35%;
}
.mj-column-per-25 {
width: 25% !important;
max-width: 25%;
}
.mj-column-px-75 {
width: 75px !important;
max-width: 75px;
}
.mj-column-px-100 {
width: 100px !important;
max-width: 100px;
}
.mj-column-px-215 {
width: 215px !important;
max-width: 215px;
}
.mj-column-px-390 {
width: 390px !important;
max-width: 390px;
}
.mj-column-per-19 {
width: 19.2% !important;
max-width: 19.2%;
}
.mj-column-per-55 {
width: 55.2% !important;
max-width: 55.2%;
}
}
@media only screen and (max-width:480px) {
table.full-width-mobile {
width: 100% !important;
}
td.full-width-mobile {
width: auto !important;
}
.footer-text {
font-size: 1.2em;
line-height: 1.4em;
}
.body-content>table>tbody>tr>td {
padding: 0 10px !important;
}
.mobile-20 {
width: 20% !important;
max-width: 20%;
}
.market-report{
width: 650px !important;
}
.content{
width: 650px !important;
}
}
.hide_on_mobile_inline {
display: inline;
}
.hide_on_mobile {
display: block;
}
.display_on_mobile_inline,
.display_on_mobile_table,
.display_on_mobile,
*[class="display_on_mobile"],
*[class].display_on_mobile {
display: none;
mso-hide: all;
max-height: 0;
overflow: hidden;
font-size: 0;
}
@media only screen and (max-width:480px) {
.hide_on_mobile {
display: none !important;
}
.display_on_mobile {
display: block !important;
}
.display_on_mobile_inline {
display: inline !important;
}
.display_on_mobile_table {
display: table !important;
}
.m-center {
text-align: center !important;
}
.m-m-auto {
margin: auto !important;
}
.h-logo>table {
margin: auto;
}
.article-body {
font-size: 18px;
line-height: 22px;
}
.cobrand-content{
/*max-width: 70% !important;*/
margin: auto !important;
}
.cobrand-avatar{
text-align:center !important;
}
.cobrand-logo img,
.cobrand-avatar img{
max-width: 100%;
}
}
96
.outlook-group-fix { width:100% !important; }
Ryan Skove has shared this article with you. View | Download
UMBS 4.0
100.84
+0.30
10YR TREASURY
2.577
-0.081
MBS COMMENTARY:
THE DAY AHEAD:
THE WEEK AHEAD:
MBS RECAP:
ALERT:
UPDATE:
MBS HUDDLE:
Big Data Week Brings Chance to Confirm Recent Shift
After several attempts to break through the low 2.7s in the past 4 months, 10yr yields finally made it into the 2.6s last Thursday and managed to hold those gains after a shaky start on Friday.
The chart above is hourly, which allows us to see last Thursday's pivot a bit better. The chart below is regular old daily candlesticks, which put the move and the 2.71-2.75 zone into broader perspective.
Considering the fact that economic data was instrumental in the bond market shift, the week ahead offers several additional opportunities (or tests?) in the form of big ticket reports. The 3 obvious examples: Monday's manufacturing PMI, Wednesday's services PMI, and Friday's jobs report.
The first of those is already out, and although the headline was slightly higher than forecast, it continues to point toward cooling in the sector.
The cooling is significantly more pronounced in the "prices paid" component. Keep in mind that anything over 50 still means prices are moving higher, but the pace of the increases has fallen sharply.
With inflation being the biggest consideration for bonds at the moment, it was no surprise to see yields fall to new multi-month lows after the report came out.
Ryan Skove
Professional Realtor, Skove Real Estate Team - eXp Realty
P: (732) 284-1116
M: (732) 217-7383
https://NJShoreRealtors.c...
SeashoreLiving.com
NJShoreRealtors.com
213 NJ-35Red Bank NJ 07701
License:
#2186472
This newsletter is a service of MBS Live.© 2022 MBS Live, LLC. | 19701 Bethel Church Rd. | Cornelius, NC 28031
All information provided "as is" for informational purposes only, not intended for trading purposes or financial advice.
This email was sent to: [recipientemail]. Please click here to UNSUBSCRIBE.
Download PDF
View on Web
What’s Causing Ongoing Home Price Appreciation?
If you’re thinking about making a move, you probably want to know what’s going to happen to home prices for the rest of the year. While experts say price growth will moderate due to the shifting market, ongoing appreciation is expected. That means home prices won’t fall. Here’s a look at two key reasons experts forecast continued price growth: supply and demand.
While Growing, Housing Supply Is Still Low
Even though inventory is increasing this year as the market moderates, supply is still low. The graph below helps tell the story of why there still aren’t enough homes on the market today. It uses data from the Census to show the number of single-family homes that were built in this country going all the way back to the 1970s.
The blue bars represent the years leading up to the housing crisis in 2008. As the graph shows, right before the crash, homebuilding increased significantly. That’s because buyer demand was so high due to loose lending standards that enabled more people to qualify for a home loan.
The resulting oversupply of homes for sale led to prices dropping during the crash and some builders leaving the industry or closing their businesses – and that led to a long period of underbuilding of new homes. And even as more new homes are constructed this year and in the years ahead, this isn’t something that can be resolved overnight. It’ll take time to build enough homes to meet the deficit of underbuilding that took place over the past 14 years.
Millennials Will Create Sustained Buyer Demand Moving Forward
The frenzy the market saw during the pandemic is because there was more demand than homes for sale. That drove home prices up as buyers competed with one another for available homes. And while buyer demand has moderated today in response to higher mortgage rates, data tells us demand will continue to be driven by the large generation of millennials aging into their peak homebuying years (see graph below):
Odeta Kushi, Deputy Chief Economist at First American, explains:
“. . . millennials continue to transition to their prime home-buying age and will remain the driving force in potential homeownership demand in the years ahead.”
That combination of millennial demand and low housing supply continues to put upward pressure on home prices. As Bankrate says:
“After all, supplies of homes for sale remain near record lows. And while a jump in mortgage rates has dampened demand somewhat, demand still outpaces supply, thanks to a combination of little new construction and strong household formation by large numbers of millennials.”
What This Means for Home Prices
If you’re worried home values will fall, rest assured that experts forecast ongoing home price appreciation thanks to the lingering imbalance of supply and demand. That means home prices won’t decline.
Bottom Line
Based on today’s factors driving supply and demand, experts project home price appreciation will continue. It’ll just happen at a more moderate pace as the housing market continues its shift back toward pre-pandemic levels.
Ryan Skove
Phone:+1(732) 301-2687