At The Shore, It Can Make Sense To Move Before Spring
Spring is usually the busiest season in the New Jersey and Monmouth County housing market. Many buyers wait until then to make their move, believing it’s the best time to find a home. However, that isn’t always the case when you factor in the competition you could face with other buyers at that time of year. If you’re ready to buy a home in Monmouth County, New Jersey, here’s why it makes sense to move before the spring market picks up.
Spring Should Bring a Wave of Buyers to the Market In most years, the housing market in New Jersey and Monmouth County goes through predictable seasonal trends in activity. Winter is typically a quiet point in the year, while spring sees a surge of buyers begin their search. And experts project that this year will be no exception.
Right now, buyer demand is low due to a combination of normal seasonal trends and a reaction to last year’s rise in mortgage rates. But rates have started to come down since last November, which has more and more potential buyers planning to jump into the market. That means right now is a sweet spot if you’re in a good position to buy, before more buyers reappear. Affordability is beginning to improve, but demand is still low — for now. Lawrence Yun, Chief Economist at the National Association of Realtors (NAR), shares:
“. . . expect sales to pick up again soon since mortgage rates have markedly declined after peaking late last year.”
If you’re ready to buy a home in Monmouth County, New Jersey, right now is the best time to do so before your competition grows and more buyers enter the market.
Today’s Sellers Are Motivated Low demand from buyers often means sellers are more motivated to work with you, and that can set you up to buy a home on your terms. In fact, sellers have been more willing to negotiate this winter because there are fewer buyers in the market. According to a recent article from Forbes:
“. . . sellers gave concessions to buyers in 41.9% of home sales in the fourth quarter of last year.”
But keep in mind, the advantages buyers have this winter won’t last forever. The competition you face could be greater if you wait until spring to make a move, and increased buyer demand means sellers will have less motivation to negotiate with you. Be sure to work with a trusted Monmouth County, New Jersey real estate professional to learn what you can expect in your local market right now.
Bottom Line If you’re in a good position to make a move in Monmouth County, New Jersey, it may make sense to move before spring. Working with your team of expert real estate advisors is the best way to learn about the current market and what it means for you. Let’s connect today to determine the best plan to achieve your homebuying goals.
Why Pricing Your House Appropriately Matters
Last year, the housing market slowed down in response to higher mortgage rates, and that had an impact on home prices. If you’re thinking of selling your house soon, that means you’ll want to adjust your expectations accordingly. As realtor.com explains:
“. . . some of the more prominent pandemic trends have changed, so sellers might wish to adjust accordingly to get the best deal possible.”
In a more moderate market, how you price your house will make a big difference to not only your bottom line, but to how quickly your house could sell. And the reality is, homes priced right are still selling in today’s market.
Why Pricing Your House Appropriately Matters
Especially today, your asking price sends a message to potential buyers.
If it’s priced too low, you may leave money on the table or discourage buyers who may see a lower-than-expected price tag and wonder if that means something is wrong with the home.
If it’s priced too high, you run the risk of deterring buyers. When that happens, you may have to lower the price to try to reignite interest in your house when it sits on the market for a while. But be aware that a price drop can be seen as a red flag by some buyers who will wonder what that means about the home.
To avoid either headache, price it right from the start. A real estate professional knows how to determine that ideal asking price. They balance the value of homes in your neighborhood, current market trends, buyer demand, the condition of your house, and more to find the right price. This helps lead to stronger offers and a greater likelihood your house will sell quickly.
The visual below helps summarize the impact your asking price can have:
Bottom Line
Homes that are priced at current market value are still selling. To make sure you price your house appropriately, maximize your sales potential, and minimize your hassle, let’s connect.
Rates May be Falling, But Other Mortgage Costs Are Going Up
Mortgage rates have fallen quite a bit since hitting a long term peak in late October. By the middle of this week, the average 30yr fixed rate was more than 1.25% lower from the highs and at the best levels in more than 4 months. Rates have fallen due to improvement in the bond market, but bonds aren't the only things that have an impact.
In addition to the costs driven by the bond market, regulators impose certain fees based on loan characteristics and they announced a big change to those fees on Thursday.
Exactly which fees are we talking about here?
This refers to Loan Level Price Adjustments (LLPAs) imposed by Fannie Mae and Freddie Mac (the "agencies"), the two entities that guaranty a vast majority of new mortgages. LLPAs are based on loan features such as your credit score, the loan-to-value ratio, occupancy (owner vs non-owner occupied homes), and now after this week's announcement, your debt-to-income ratio (DTI).
What lenders/loans does this apply to?
Any loan guaranteed by one of the agencies regardless of the lender. This is MOST loans in the US. Examples of loans that wouldn't be affected would be FHA/VA as well as certain jumbo and specialty products. "Non-conforming" loans are not impacted by this as they are not guaranteed by the agencies. A common example of a non-conforming loan would be a jumbo loan from a retail bank or credit union.
When does this take effect?
This applies to loans that are guaranteed by the agencies starting May 1st, 2023. That means many lenders will begin to implement the changes in March/April.
What changed, in a nutshell?
While you'll still get the best terms with the highest credit score, the effective penalty for having a credit score under 680 is now smaller than it was. For instance, if you have a score of 659 and are borrowing 75% of the home's value, you'll pay a fee equal to 1.5% of the loan balance whereas you'd pay no fee if you had a 780+ credit score. But before these changes, you would have paid a whopping 2.75% fee. On a hypothetical $300k loan, that's a difference of $3750 in closing costs.
The following table shows LLPAs in terms of percentages of the loan balance. The top row is the loan-to-value ratio (LTV) and the column on the left is credit score (FICO). For instance a FICO of 740-759 with 75-80 LTV would have an LLPA of 0.875% or $875 for every $100k borrowed. The same loan amount on the same property would have an LLPA of 2.75 or $2750 for every $100k if your FICO was 639 or less.
For those wondering why higher LTVs begin to cost less after 85%, part of the reason is the implied presence of mortgage insurance (the higher the LTV, the higher the amount of mortgage insurance coverage required). The other reason is that Fannie and Freddie's congressional mandate involves fostering affordable housing and promoting home ownership. Their regulator, FHFA said in a statement that these LLPA changes "maintain support for single-family purchase borrowers limited by wealth or income." In other words, if you can't afford a big down payment, FHFA is cutting you a break.
That notion is even more apparent when we examine how the LLPA grid changed from the previous version. The biggest improvements in costs were seen in credit scores of 679 and lower. Those improvements were "paid for" by making things more expensive elsewhere in the grid.
Borrowers with higher credit scores will generally be paying a bit more than they were under the previous structure. The following chart shows the differences. Green cells show where things have become more affordable than they were. Red cells = more expensive. All values refer to a percentage of the loan balance charged as an upfront fee. This doesn't necessarily come out of your pocket upfront as lenders can offer higher interest rates in some cases and pay these costs for you (but the costs are still there, and still technically being paid by you over time in the form of higher interest rates).
There are many other changes that aren't so easily translated to a heat-map table. The most notable is a new charge for DEBT-TO-INCOME (DTI) ratio. This will be controversial in many scenarios as income calculations can be somewhat subjective and debt calculations can be legitimately "tweaked" with some advanced planning and/or debt consolidation. Nonetheless, every loan guaranteed by the agencies has a DTI attached to it. If yours is over 40% and you're borrowing more than 60% of your home's value, you'll be paying more.
A few other examples of changes:
There are new credit score bands at 760+ and 780+.
There is more differentiation in high-balance vs non-high-balance ARM loans (uncommon... most ARMs are not done through the agencies)
to 2-4 unit property LLPAs moved lower across the board
There's a new generic LLPA for "subordinate financing" (a 2nd loan or HELOC) whereas the previous LLPAs were more granular depending on the LTV of first loans vs subordinate loans
BIG increases in fees for many "Cash-Out" loans
Where can I see the actual, specific changes?
If you have a loan in process or soon will, these changes likely won't apply to you. Again, most lenders won't implement them right away. Ask your lender for clarification. If you're asking them this week, they may not be aware of the changes yet!
The official changes are here:
https://singlefamily.fanniemae.com/media/9391/display
NOTE: at the top of that page, there is a link to the PREVIOUS/EXISTING version of the LLPAs (or you can click here). Just be sure to note the text at the top of whichever page you're viewing, so you know if it applies to loans before or after 5/1/2023 (and keep in mind that "after 5/1/2023" will refer to most loans originated in March/April).
Who decided that these changes should happen?!
The FHFA. Here's their statement: https://www.fhfa.gov//Media/PublicAffairs/Pages/FHFA-Announces-Updates-to-Enterprises-SF-Pricing-Framework.aspx
Shifting gears to this week's economic data and market movement, we received several monthly housing-related reports--several of which suggested the negative momentum may be ebbing or even reversing.
The National Association of Homebuilders posted builder confidence numbers that were 4 points higher than expected and 4 points up from last month.
The Mortgage Bankers Association (MBA) reported a big increase in both purchase and refinance applications relative to last week's numbers.
The Commerce Department tallied fewer housing starts this month, but the number beat the median forecast.
Last by not least, the National Association of Realtors (NAR) reported that Existing Home Sales remained above an annual pace of 4 million units--slightly higher than the 3.96 million expected by analysts.
The bond market put in a mixed performance with improvement on Wednesday resulting in the lowest rates in 4 months. Thursday was fairly flat and Friday saw some deterioration. By the end of the week, trading levels were almost perfectly in line with those seen at the end of last week.
Full Calendar
Recently Released Economic Data
Time
Event
Period
Actual
Forecast
Prior
Tuesday, Jan 17
8:30
Jan NY Fed Manufacturing
Jan
-32.9
-9.00
-11.20
Wednesday, Jan 18
7:00
w/e MBA Purchase Index
w/e
198.7
159.4
7:00
w/e MBA Refi Index
w/e
438.3
326.7
8:30
Dec Retail Sales (%)
Dec
-1.1
-0.8
-0.6
8:30
Dec Producer Prices (%)
Dec
-0.5
-0.1
0.3
8:30
Dec Core Producer Prices YY (%)
Dec
5.5
5.7
6.2
9:15
Dec Industrial Production (%)
Dec
-0.7
-0.1
-0.2
10:00
Jan NAHB housing market indx
Jan
35
31
31
10:00
Nov Business Inventories (% )
Nov
+0.4
0.4
0.3
13:00
20-Yr Bond Auction (bl)
12
Thursday, Jan 19
8:30
Dec House starts mm: change (%)
Dec
-1.4
-0.5
8:30
Dec Building permits: number (ml)
Dec
1.330
1.370
1.351
8:30
Dec Housing starts number mm (ml)
Dec
1.382
1.359
1.427
8:30
Dec Build permits: change mm (%)
Dec
-1.6
-10.6
8:30
Jan Philly Fed Business Index
Jan
-8.9
-11.0
-13.8
8:30
w/e Jobless Claims (k)
w/e
190
214
205
Friday, Jan 20
10:00
Dec Exist. home sales % chg (%)
Dec
-1.5
-5.4
-7.7
10:00
Dec Existing home sales (ml)
Dec
4.02
3.96
4.09
Upcoming Economic Data
Time
Event
Period
Forecast
Prior
Monday, Jan 23
10:00
Dec Leading index chg mm (%)
Dec
-0.7
-1.0
Tuesday, Jan 24
9:45
Jan Markit Composite PMI
Jan
47.0
45.0
13:00
2-Yr Note Auction (bl)
42
Wednesday, Jan 25
13:00
5-Yr Note Auction (bl)
43
Thursday, Jan 26
8:30
Q4 GDP Advance (%)
Q4
2.6
3.2
8:30
Dec Durable goods (%)
Dec
2.6
-2.1
8:30
w/e Jobless Claims (k)
w/e
205
190
10:00
Dec New Home Sales (ml)
Dec
0.614
0.640
10:00
Dec New Home Sales (%) (%)
Dec
-4.7
5.8
13:00
7-Yr Note Auction (bl)
35
Friday, Jan 27
8:30
Dec Core PCE Inflation (y/y) (%)
Dec
4.4
4.7
10:00
Jan Consumer Sentiment (ip)
Jan
64.6
64.6
10:00
Jan Sentiment: 1y Inflation (%)
Jan
4.0
10:00
Dec Pending Sales Index
Dec
73.9
10:00
Jan Sentiment: 5y Inflation (%)
Jan
3.0
10:00
Dec Pending Home Sales (%)
Dec
-1.0
-4.0
Event Importance:No Stars = Insignificant | Low | Moderate | Important | Very Important
More Headlines
NJShoreRealtors Blog
Rate
Change
Points
30 Yr. Fixed
6.15%
+0.04
--
15 Yr. Fixed
5.19%
+0.04
--
30 Yr. FHA
5.75%
+0.05
--
30 Yr. Jumbo
5.70%
+0.04
--
5/1 ARM
6.00%
+0.04
--
Source: Mortgage News Daily
Rate
Change
Points
30 Yr. Fixed
6.23%
-0.19
0.67
15 Yr. Fixed
5.58%
-0.36
0.54
30 Yr. FHA
6.26%
-0.13
1.05
30 Yr. Jumbo
6.08%
-0.01
0.40
5/1 ARM
5.31%
-0.06
0.74
Source: The Mortgage Bankers Association
Rate
Change
Points
30 Yr. Fixed
6.15%
-0.46
0.00
15 Yr. Fixed
5.28%
-0.70
0.00
Source: Freddie Mac
CONTACT ME
Market Data
MBS
Price
Change
UMBS 4.5
98.55
-0.31
UMBS 5.0
100.23
-0.20
UMBS 5.5
101.34
-0.16
GNMA 4.5
98.89
-0.28
GNMA 5.0
100.33
-0.19
GNMA 5.5
101.13
-0.17
US Treasuries
Yield
Change
2 YR
4.177
+0.048
5 YR
3.565
+0.079
10 YR
3.482
+0.083
30 YR
3.649
+0.080
Pricing as of: 1/20 5:30PM
Recent Housing Data
Value
Change
Mortgage Apps
Jan 18
238.7
27.85%
Building Permits
Nov 1
1.34M
-11.24%
Housing Starts
Nov 1
1.43M
-0.49%
New Home Sales
Oct 1
632K
7.48%
Existing Home Sales
Dec 1
3.6M
-1.37%
Builder Confidence
Dec 1
31
-6.06%
Existing Home Sales Shrink for 11th Month
30YR Fixed
6.11%
+0.07%
15YR Fixed
5.15%
+0.03%
Existing Home Sales Shrink for 11th Month
Existing home sales fell back for the 11th straight month in December according to the National Association of Realtors® (NAR) The month’s sales of pre-owned single-family houses, townhouses, condominiums, and cooperative apartments were at a seasonally adjusted annual rate of 4.02 million units. This is down 1.5 percent from November’s activity and 34.0 percent lower than in December 2022.
Single-family home sales declined by 1.1 percent to a seasonally adjusted annual rate of 3.60 million from 3.64 million in November and were down 33.5 percent from the previous year. Existing condominium and co-op sales came in at a seasonally adjusted annual rate of 420,000 units, a decline of 4.5 percent and 38.2 percent from the two earlier periods.
The December results were slightly better than expected. Analysts polled by Econoday and Trading Economics each came in with a consensus estimate of 3.97 units.
For the entirety of 2022 there were 5.03 million existing homes sold. This was 17.8 percent fewer than in 2021, as last year’s rapidly escalating interest rate environment weighed on the residential real estate market.
“December was another difficult month for buyers, who continue to face limited inventory and high mortgage rates,” said NAR Chief Economist Lawrence Yun. He said, however, he expects sales to pick up again soon since mortgage rates have markedly declined after peaking late last year.
As sales have slowed, so has the rate of appreciation, but prices are still moving higher on a year-over-year basis. The median price for existing homes in December was $366,900, an increase of 2.3 percent from the median of $358,800 a year earlier. This marks 130 consecutive months of year-over-year increases, the longest-running streak on record. The median existing single-family home price was $372,700, up 2.0 percent from December 2021, and the median condo price of $317,200 marked an annual increase of 3.3 percent.
“Home prices nationwide are still positive, though mildly,” Yun added. “Markets in roughly half of the country are likely to offer potential buyers discounted prices compared to last year.”
At the end of the reporting period, there were 970,000 housing units available for sale, an estimated 2.9-month supply at the current pace. This is a 13.4 percent decline from November’s 3.3-month supply but represents 10.2 growth from the 880,000 units on the market in December 2021 when the absorption period was estimated at 1.7 months.
Properties typically remained on the market for 26 days in December, up from 24 days in November and 19 days in December 2021. Fifty-seven percent of homes sold in December 2022 were on the market for less than a month.
Thirty-one percent of sales during the month were to first-time buyers, a 3-point increase from November. Those buyers were responsible for 26 percent of sales last year, the lowest since NAR began tracking the data.
All-cash sales accounted for 28 percent of transactions in December, up from 26 percent in November and 23 percent in December 2021. Individual investors or second-home buyers, who account for many cash sales, purchased 16 percent of homes in December. Yun commented that cash buyers are unaffected by fluctuations in mortgage rates and were able to take advantage of lower prices in some areas.
Sales slipped in three of the four major regions compared to November and were lower than a year earlier in all four. In the Northeast, the annual rate was 520,000 units, down 1.9 percent from November and 28.8 percent on an annual basis. The median price in the region was $391,400, an increase of 1.6 percent from the prior year.
Existing-home sales in the Midwest fell 1.0 percent from the previous month to an annual rate of 1.01 million in December and were off 30.3 percent from the December 2021 rate. The median price rose 2.9 percent to $262,000.
Existing-home sales slipped 2.2 percent in the South to an annual rate of 1.80 million, a 33.1 percent lower than the previous year. The median price, $337,900, is 3.5 percent higher than a year earlier.
Sales in the West were unchanged at an annual rate of 690,000 units but had plunged by 43.4 percent from the prior December. The price tag of $557,900 was only $200 more than the median in December 2021, less than a tenth of a percent growth.
Mortgage Pre-Approval in 2023: One Of The First Steps
Pre-Approval in 2023: What You Need To Know
One of the first steps in your homebuying journey is getting pre-approved. To understand why it’s such an important step, you need to understand what pre-approval is and what it does for you. Business Insider explains:
“In a preapproval [sic], the lender tells you which types of loans you may be eligible to take out, how much you may be approved to borrow, and what your rate could be.”
Basically, pre-approval gives you critical information about the homebuying process that’ll help you understand your options and what you may be able to borrow.
How does it work? As part of the pre-approval process, a lender will look at your finances to determine what they’d be willing to loan you. From there, your lender will give you a pre-approval letter to help you understand how much money you can borrow. That can make it easier when you set out to search for homes because you’ll know your overall numbers. And with higher mortgage rates impacting affordability for many buyers today, a solid understanding of your numbers is even more important.
Pre-Approval Helps Show You’re a Serious Buyer
Another added benefit is pre-approval can help a seller feel more confident in your offer because it shows you’re serious about buying their house. A recent article from Forbes notes:
“From the seller’s perspective, a preapproval [sic] letter from a reputable local lender often can make the difference between accepting and rejecting an offer.”
This goes to show, even though you may not face the intense bidding wars you saw if you tried to buy during the pandemic, pre-approval is still an important part of making a strong offer. In fact, Christy Bieber, Personal Finance Writer at The Motley Fool explains it may be the most important part of making an offer:
“Pre-approval maximizes the chances you’ll be able to actually close the deal – and sellers want to see that.
The fact that a pre-approval gives you a better chance of getting your offer accepted is undoubtedly the most important reason to complete this step . . .”
Bottom Line
Getting pre-approved is an important first step towards buying a home. It lets you know what you can borrow and shows sellers you’re serious about purchasing their home. Connect with a local real estate professional and a trusted lender so you have the tools you need to purchase a home in today’s market.
Have Home Values Hit Bottom?
Whether you’re already a homeowner or you’re looking to become one, the recent headlines about home prices may leave you with more questions than answers. News stories are talking about home prices falling, and that’s raising concerns about a repeat of what happened to prices in the crash in 2008.
One of the questions that’s on many minds, based on those headlines, is: how much will home prices decline? But what you may not realize is expert forecasters aren’t calling for a free fall in prices. In fact, if you look at the latest data, there’s a case to be made that the biggest portion of month-over-month price depreciation nationally may already behind us – and even those numbers weren’t significant declines on the national level. Instead of how far will they drop, the question becomes: have home values hit bottom?
Let’s take a look at the latest data from several reputable industry sources (see chart below):
The chart above provides a look at the most recent reports from Case-Shiller, the Federal Housing Finance Agency (FHFA), Black Knight, and CoreLogic. It shows how, on a national scale, home values have changed month-over-month since January 2022. November and December numbers have yet to come out.
Let’s focus in on what the red numbers tell us. The red numbers are the change in home values over the last four months that have been published. And if we isolate the last four months, what the data shows is, in each case, home price depreciation peaked in August.
While that doesn’t guarantee home price depreciation has hit bottom, it confirms prices aren’t in a free fall, and it may be an early signal that the worst is already behind us. As the numbers for November and December are released, data will be able to further validate this national trend.
Bottom Line
Home prices month-over-month have depreciated for the past four months on record, but there’s a strong case to be made that the worst may be behind us. If you have questions about what’s happening with home prices in our local market, let’s connect.
Builders See a Turn-Around in Housing Starts on the Horizon
30YR Fixed
6.04%
-0.13%
15YR Fixed
5.12%
-0.16%
Builders See a Turn-Around in Housing Starts on the Horizon
On top of the solid report on mortgage volume earlier today, comes another hopeful report from the construction industry. The National Association of Home Builders (NAHB) says builder confidence in the new home market has improved for the first time in January after 12 straight months of declines.
The NAHB/Wells Fargo Housing Market Index, a measure of builder confidence rose 4 points to 35, an increase which NAHB’s chief economist Robert Dietz said was due in part to a modest drop in interest rates. He added, however, that builder sentiment “remains in bearish territory as builders continue to grapple with elevated construction costs, building material supply chain disruptions, and challenging affordability conditions.”
Derived from a monthly survey that NAHB has been conducting for more than 35 years, the HMI gauges builder perceptions of current single-family home sales and sales expectations for the next six months as “good,” “fair” or “poor.” The survey also asks builders to rate traffic of prospective buyers as “high to very high,” “average” or “low to very low.” Scores for each component are then used to calculate a seasonally adjusted index where any number over 50 indicates that more builders view conditions as good than poor.
All three HMI indices posted gains for the first time since December 2021. The HMI index gauging current sales conditions in January rose 4 points to 40, the component charting sales expectations in the next six months increased 2 points to 37 and the gauge measuring traffic of prospective buyers increased 3 points to 23.
Dietz said, “It is possible that the low point for builder sentiment in this cycle was registered in December, even as many builders continue to use a variety of incentives, including price reductions, to bolster sales. The rise in builder sentiment also means that cycle lows for permits and starts are likely near, and a rebound for home building could be underway later in 2023.”
NAHB forecasts that single-family starts in 2023 will still be lower than in 2022, but it appears a turning point for housing lies ahead. In the coming quarters, single-family home building will rise off of cycle lows as mortgage rates are expected to trend lower and boost housing affordability. Improved housing affordability will increase housing demand, as the nation grapples with a structural housing deficit of 1.5 million units.
Looking at the three-month moving averages for regional HMI scores, the West registered a 1-point gain to 27, the South held steady at 36, the Northeast fell 4 points to 33 and the Midwest dropped 2 points to 32.
Lower Inflation Portends Further Slide in Mortgage Rates
A dip below 6% has become a distinct possibility, says NAR Chief Economist Lawrence Yun.
Inflation has been dropping over the past six months, and consumers can expect mortgage rates to soon follow, says Lawrence Yun, chief economist for the National Association of REALTORS®. The 30-year fixed-rate mortgage could even drop below 6%, Yun adds. That would be welcome news to home buyers who were shell-shocked by the surge in rates above 7% this fall, which prompted a sudden contraction in the housing market.
Mortgage rates have been receding over recent weeks, with the 30-year fixed-rate mortgage averaging 6.33% this week, according to Freddie Mac’s weekly survey. Since peaking in mid-November, mortgage rates have now fallen by 0.75 percentage points. “The gate is beginning to open for home buyers who got shut out in October and November when the rates went above 7%,” says Yun. “However, there is still a housing shortage and not enough listings.” That likely will keep home prices higher, economists note.
Inflation was at 6.45% in December, according to data released this week, which is down considerably from a peak of 9.1% in June 2022. “Housing inflation due to rising rents is the one major item still showing acceleration but is soon expected to come down as well,” Yun says.
Rents rose by 8.35% in December, the highest increase in more than 40 years. But recent housing data has indicated that rents have begun to fall: Realtor.com®, for example, reports that rents have dropped in many of the nation’s hottest real estate markets after rising more than 20% over the past three years. Also, robust apartment construction likely will raise rental vacancy rates, which could help further ease rental prices in the months ahead, Yun adds.
The housing market has become “hypersensitive” to weekly movements in mortgage rates, says Sam Khater, Freddie Mac’s chief economist. Mortgage applications for home purchases have experienced large swings relative to even small changes in rates, he adds. “Over the last few weeks, latent demand has been on display, with buyers jumping in and out of the market as rates move,” Khater says.
After several weeks of dropping mortgage rates, however, aspiring buyers may gain some confidence to move forward. “This downward trend of mortgage rates gives a scrap of hope for many home buyers for the months ahead,” says Nadia Evangelou, NAR’s senior economist and director of forecasting. “With a 6% rate instead of 7%, buyers pay about $2,700 less every year on their mortgage. As a result, owning a home becomes affordable to about 1.4 million more renters and 4.3 million more homeowners. This could bring more buyers back to the market, boosting demand for housing and increasing market competition.”
Freddie Mac reports the following national averages with mortgage rates for the week ending Jan. 12:
30-year fixed-rate mortgages: averaged 6.33%, dropping from last week’s 6.48% average. A year ago, 30-year rates averaged 3.45%.
15-year fixed-rate mortgages: averaged 5.52%, also dropping from last week’s 5.73% average. A year ago, 15-year rates averaged 2.62%.
Waiting for 3% Mortgage Rates? You Might Want To Think Twice
Last year, the Federal Reserve took action to try to bring down inflation. In response to those efforts, mortgage rates jumped up rapidly from the record lows we saw in 2021, peaking at just over 7% last October. Hopeful buyers experienced a hit to their purchasing power as a result, and some decided to press pause on their plans.
Today, the rate of inflation is starting to drop. And as a result, mortgage rates have dipped below last year’s peak. Sam Khater, Chief Economist at Freddie Mac, shares:
“While mortgage market activity has significantly shrunk over the last year, inflationary pressures are easing and should lead to lower mortgage rates in 2023.”
That’s potentially great news if you’re a buyer aiming to jump back into the housing market. Any drop in mortgage rates helps boost your purchasing power by bringing down your expected monthly mortgage payment. This means the lower mortgage rates experts forecast this year could be just what you need to reignite your homebuying goals.
While this opens up a window of opportunity for you, remember: you shouldn’t expect rates to drop back down to record lows like we saw in 2021. Experts agree that’s not the range buyers should bank on. Greg McBride, Chief Financial Analyst at Bankrate, explains:
“I think we could be surprised at how much mortgage rates pull back this year. But we’re not going back to 3 percent anytime soon, because inflation is not going back to 2 percent anytime soon.”
It’s important to have a realistic vision for what you can expect this year, and that’s where the advice of expert real estate advisors is critical. You may be surprised by the impact even a mild drop in mortgage rates has on your budget. If you’re ready to buy a home now, today’s market presents the opportunity to get a more affordable mortgage rate, find your dream home, and face less competition from other buyers.
Bottom Line
The recent pullback in mortgage rates is great news – but if you’re ready to buy now, holding out for 3% is a mistake. Work with a local lender to learn how today’s rates impact your goals, and let’s connect to explore your options in our area.
If Rates Are at 4-Month Lows, Why Does The Fed Say They're Going Higher?
30YR Fixed
6.09%
+0.02%
15YR Fixed
5.27%
+0.02%
If Rates Are at 4-Month Lows, Why Does The Fed Say They're Going Higher?
Mortgage rates officially hit their lowest levels in 4 months after this week's inflation data. Despite the recent progress, Fed officials continue to talk about keeping rates high "for as long as possible." Who's telling the truth?
First off, we know that mortgage rates are at 4 month lows because that assertion relies on the past as opposed to the future. You'd have to go back to September 12th to see anything lower for the average lender. We also know that inflation has been the driving force behind the tremendous rate volatility seen over the past 12 months.
Specifically, the Consumer Price Index (CPI) has been at the scene of the crime for most of the largest rate moves. Up until November, all but one of those large moves was toward higher rates, but things have shifted since then.
Rates respond to inflation data because rates are based on bonds and inflation directly impacts the returns on bonds. They're responding more than normal in the past year because inflation jumped at the fastest pace in 40 years in 2022. Recent reports show progress on the inflation front, so longer term rates like mortgages are showing some hope for the future.
All of the above makes sense from a logical standpoint, so why do Fed officials continue saying that more rate hikes are needed and that rates will remain high as long as possible?
One source of confusion is the fact that the Fed Funds Rate (the thing the Fed hikes/cuts/etc) is different than mortgage rates. The Fed Funds Rate applies to overnight lending between large institutions and has the biggest impact on the shortest-term bonds. The longer a bond lasts, the more it can vary from the Fed's rate.
The Fed sees the potential ceiling bounce in inflation and thinks "that's great, but let's not get complacent. We have to get inflation back into the 2% range."
The Fed coaxes inflation lower by keeping short term rates high. That impedes the flow of credit across the financial market, ultimately slowing down economic demand enough that sellers are forced to lower prices. That's the oversimplified idea anyway.
While some might argue that the Fed has already hiked enough that inflation will surely continue to fall, the Fed is concerned about repeating a mistake from the 80s when it cut rates too soon and inflation flared back up. They're particularly sensitive to this risk due to a still-very-strong job market.
In other words, the Fed has to stick to a tough, inflation fighting script or risk the market becoming exuberant at the thought of potential rate cuts. Such exuberance could undo some of the progress made against inflation recently.
Despite the Fed's tough talk, they are beginning to acknowledge that it's time to slow down the pace of rate hikes. At this point, the market only sees the Fed being able to hike two more times and by a smaller amount than last time. Once the Fed stops hiking, they've been unified in their goal to keep rates high for as long as possible.
It's impossible to know how long "as long as possible" will be. What we do know is that the rate path will take cues from inflation and employment data. If inflation continues to fall and unemployment moves higher, the market will increasingly bet on the Fed cutting rates. For now though, with inflation just starting to confirm a shift and unemployment still very low, it's not a surprise to see the rate outlook settling in a narrower, more sideways pattern.
The silver lining is the fact that longer term rates often begin their descent well before the Fed when it comes to these hike/cut cycles. The chart below shows how this played out with 10yr Treasury yields (highly correlated with mortgage rates) and the Fed Funds Rate most recently.
We won't know whether the Fed will decrease the size of its next rate hike until February 1st. Between now and then, markets will be paying careful attention to economic data, looking for any evidence of an inflation resurgence or an acceleration in wage growth. Data available over the next 3 weeks is not quite in the same league as the data of the past 2 weeks, so markets may not move with as much conviction until hearing from the Fed.
The bond market and most mortgage lenders will be closed on Monday for the Martin Luther King Jr. holiday
Lowest Rates in 4 Months After Inflation Data
30YR Fixed
6.07%
-0.08%
15YR Fixed
5.25%
-0.12%
Lowest Rates in 4 Months After Inflation Data
Today brought the scheduled monthly release of the Consumer Price Index (CPI). Of all the monthly economic reports, this one has had the biggest impact on the bond market and mortgage rates for roughly an entire year now.
October's CPI (reported November 10th) was the biggest revelation as it was viewed by many as a sign of a shift away from the hyperinflation of 2022. November's report offered no objection and now December's report (today) paints a similar, calmer picture.
Inflation has been the biggest source of upward pressure on rates during what has been the fastest rate spike in 40 years. Even if it's merely heading back in the right direction, it's a big win for rates. That winning process has played out over the course of these three CPI reports albeit with some back and forth along the way.
The average lender brought rates roughly 0.125% lower today versus yesterday. This makes for conventional 30yr fixed rates in the low 6% range. You'd have to go back exactly 4 months to see anything lower.
Refinance Volume Reflects Lower Rates
30YR Fixed
6.07%
-0.08%
15YR Fixed
5.25%
-0.12%
Refinance Volume Reflects Lower Rates
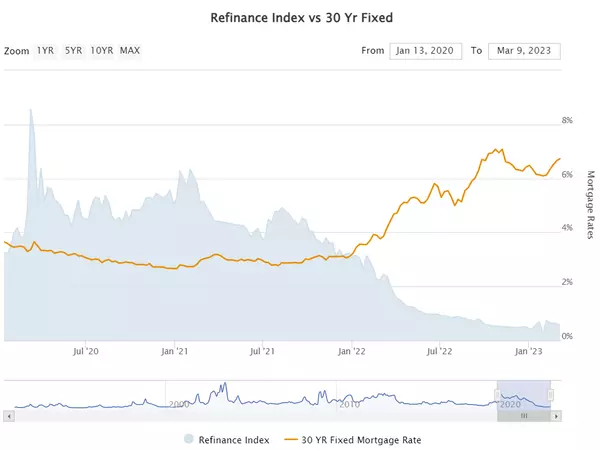
Overall mortgage application activity returned to pre-holiday levels during the first week of the new year. Lower interest rates bolstered refinancing and the Mortgage Bankers Association said its Market Composite Index, a measure of mortgage loan application volume, increased 1.2 percent on a seasonally adjusted basis from one week earlier. On an unadjusted basis, the Index was up 48 percent compared to its December 30 level.
The Refinance Index rose 5 percent from the previous week but was 86 percent lower than the same week one year ago. Refinancing accounted for 30.7 percent of applications during the week, up from 30.3 percent the previous week.View Refinance Applications Chart
The seasonally adjusted Purchase Index dipped 1.0 percent compared to the prior week but was 47 percent higher on an unadjusted basis week-over-week. Purchase loan activity was 44 percent lower than the same week one year ago.
View Purchase Applications Chart“Mortgage rates declined last week as markets reacted to data showing a weakening economy and slowing wage growth,” Joel Kan, MBA’s Vice President and Deputy Chief Economist said. “All loan types in the survey saw a decline in rates, with the 30-year fixed rate falling to 6.42 percent. Purchase applications continued to be hampered by broader weakness in the housing market and declined slightly over the week, with the index slipping to its lowest level since 2014. There was an increase in refinance activity as a result of the 16-basis-point decline in rates, as both conventional and government refinance applications increased. However, the overall pace of refinance applications was lower than November and December’s 2022 averages, and over 80 percent lower than a year ago. Refinances were about 30 percent of all applications last week — well below the past decade’s average of 58 percent.”
Other highlights from MBA’s Weekly Mortgage Application Survey.
The average size of a loan ticked up to $349,900 from $347,600 at the end of 2022. Purchase loan sizes rose from $387,600 to $389,000.
The FHA share of total applications decreased to 13.4 percent from 14.0 percent and the VA share dipped to 13.2 percent from 13.4 percent. The USDA share was unchanged at 0.6 percent.
The average contract interest rate for 30-year fixed-rate mortgages (FRM) that qualified for 2023’s new conforming loan limits of $726,200 decreased to 6.42 percent from 6.58 percent, with points remaining at 0.73.
The rate for jumbo 30-year FRM decreased to 6.09 percent from 6.12 percent, with points increasing to 0.66 from 0.45.
Thirty-year FRM backed by the FHA had an average rate of 6.39 percent with 1.03 points. The prior week the rate was 6.45 percent with 1.24 points.
Fifteen-year rates averaged 5.94 percent, down from 6.06 percent, with points decreasing to 0.62 from 0.70.
The 5/1 adjustable-rate mortgage (ARM) rate dropped 24 basis points to 5.37 percent while points increased to 0.72 from 0.62. The ARM share of application activity was unchanged at 7.3 percent.
Housing Market Is Nothing Like 15 Years Ago
Today’s Housing Market Is Nothing Like 15 Years Ago
There’s no doubt today’s housing market is very different than the frenzied one from the past couple of years. In the second half of 2022, there was a dramatic shift in real estate, and it caused many people to make comparisons to the 2008 housing crisis. While there may be a few similarities, when looking at key variables now compared to the last housing cycle, there are significant differences.
In the latest Real Estate Forecast Summit, Lawrence Yun, Chief Economist at the National Association of Realtors (NAR), drew the comparisons below between today’s housing market and the previous cycle:
Looking at the facts, it’s clear: today is very different than the housing market of 15 years ago.
There’s Opportunity in Real Estate Today
And in today’s market, with inventory rising and less competition from other buyers, there’s opportunity right now. According to David Stevens, former Assistant Secretary of Housing:
“So be advised…this may be the one and only window for the next few years to get into a buyer’s market. And remember…as the Federal Reserve data shows…home prices only go up and always recover from recessions no matter how mild or severe. Long term homeowners should view this market…right now…as a unique buying opportunity.”
Bottom Line
Today’s housing market is nothing like the real estate market 15 years ago. If you’re a buyer right now, this may be the chance you’ve been waiting for.
NJ Turnpike, Garden State Parkway to get more expensive in 2023
New Jersey motorists will have to dish out more cash starting in the new year, with toll increases planned on the New Jersey Turnpike and Garden State Parkway, plus for all the Hudson River crossings.On Jan. 1, 2023, tolls will climb 3% on the parkway and turnpike - the increases amount to cents - while the Hudson River crossings will soon top out at $17 during peak hours for drivers not using E-ZPass.Sen. Joe Pennacchio (R-Morris) said that while he understands tolls need to increase to fund worthwhile projects on New Jersey roadways, he also said they've gotten to an "insane price.""I think it's done to discourage people from driving their cars everywhere, which is fine. But the alternative sometimes just doesn't work for people that have to feed their families," he said.Here are all the new costs for drivers going through toll plazas:Parkway tolls will increase from $1.96 to $2.02 for E-ZPass customers, and from $2 to $2.10 for cash tolls.The Toms River plaza toll will go up from 97 cents to $1.01 for E-ZPass users and from $1 to $1.05 for drivers paying cash.Turnpike tolls, on average, will increase from $4.95 to $5.10 for passenger cars. Costs for E-ZPass users during peak periods will go up an average of 16 cents, and off-peak rates will increase 13 cents.Hudson River crossing tolls will increase $1 during peak and off-peak hours starting Jan. 8.Keeping toll increases below the level of inflation is helpful for drivers, said Felicia Park-Rogers, director of regional infrastructure projects for the Tri-State Transportation Campaign, a nonprofit promoting sustainable transportation policies in the New York City metro area.The news is less expensive for NJ Transit riders, who will see no fare increases for at least the first half of 2023, the fifth year ticket prices will remain flat.Meanwhile, the feud over congestion pricing in New York City continues. The controversial plan would charge drivers up to $23 a day to drive south of 60th Street in Manhattan.
State lawmakers are urging New York officials to reconsider the pricing plan, which currently has no timeline for implementation. The Metropolitan Transportation Authority has to respond to 66,000 written comments and continue studying traffic modeling, the agency has said during public hearings.U.S. Rep. Josh Gottheimer, a congestion pricing opponent, announced a proposal earlier this year that would offer tax incentives to New York businesses that open regional offices in New Jersey. The New Jersey Assembly in October unanimously passed a resolution formally opposing the congestion pricing plan.A resolution hasn't been introduced in the Senate, though such measures are only symbolic. Pennacchio said there is little the Legislature can do to fight the congestion pricing plan, other than lobby New York officials."I would hope the administration is looking into ways to do that," he said. "Perhaps we can make the pain equal or greater to our New York friends so they won't do that."A spokesman for the New Jersey Turnpike Authority did not respond to a request for comment.
Netflix sets the scene with $903M studio plan for Fort Monmouth
Netflix sets the scene with $903M studio plan for ex-military base Bidding for “mega parcel,” streaming service envisions massive facility to anchor its East Coast productions.
Netflix unveiled plans last week for an investment of $903 million in a production facility at the former Fort Monmouth in New Jersey that would serve as a central point in the streaming entertainment giant’s East Coast operations.Netflix emerged in October as the top bidder among four seeking to acquire a 289-acre “mega parcel” that covers about a quarter of the longtime U.S. Army base, which closed in 2011.The company disclosed the bid amount on Wednesday as $55 million with an additional $850 million planned to construct a massive state-of-the-art Netflix Studios Fort Monmouth facility. Renderings show multistory production stage buildings and offices tucked behind the familiar Fort Monmouth archways.“This will be among our largest, kind of on a par with our 300-acre facility in Albuquerque,” Netflix’s director of content and studio affairs Rajiv Dalal told NJ Advance Media in an interview.“We’re super-excited about moving one step closer to actually making this is a reality,” said Dalal, a North Caldwell native.Netflix estimates that, during construction, the project would generate up to 3,500 jobs. Once the facility is operational — Netflix did not provide a targeted opening date — it would provide from 1,400 to 2,200 jobs, a Netflix spokesperson said.“Economic impact is a key driver of why we felt our proposal was best in class. We’re looking at jobs, jobs, jobs,” Dalal said.The Fort Monmouth Economic Revitalization Authority was expected to consider the bid and plans when it met at 5 p.m. Wednesday.The proposed Netflix Studios Fort Monmouth would be the company’s main East Coast production hub.“You’re going to have many, many titles that are made in New Jersey and seen by the rest of the world,” Dalal said.A Netflix spokesperson said the San Francisco-based, streaming service and production company has had a positive experience filming in New Jersey, including scenes in Atlantic City for “Army of the Dead,” a zombie heist movie released in 2021.“New Jersey has top-notch crews and talent, and a vibrant creative sector, which we intend to tap into and further enrich,” the company spokesperson said.
Approval by the Fort Monmouth Economic Revitalization Authority, which is overseeing redevelopment of the base, would be a key first step in the process. Netflix would still need various approvals from local, county and state officials, including Gov. Phil Murphy, who has veto power over the authority.Murphy’s administration, in October, issued a supportive but noncommittal statement, upon the prior announcement that Netflix was among the four bidders. The others are Extell Acquisitions LLC, Mega Parcel Development LLC and RDR Partners LLC, which includes three other LLC’s, Russo Development, Dinallo Development and River Development.“Governor Murphy is delighted to hear that Netflix is interested in establishing a serious presence in New Jersey,” his office said at the time. “He looks forward to working with them and the rest of the industry to create good-paying jobs and spur economic growth throughout the state.”The proposed Netflix facility would provide a backdrop for TV series and films and serve as a tourism draw, the company said.The Netflix proposal would not impact parts of the base scheduled for preservation, such as Fort Monmouth’s parade grounds, World War II Memorial and Cowan Park.“Those will stay open to the community,” Dalal said. “We’re going to do screenings in the park in the summer.”The spokesperson estimated that the value to the New Jersey economy over a 20-year period, as a direct result of construction and production activity, would be between $3.8 billion and $4.6 billion.Netflix also would bring in training programs for workforce development.Dalal said that a substantial part of the $850 million cost will involve tearing down buildings and site remediation, factors that are typically part of transforming a former military base.Two Netflix productions that debuted this fall involved New Jersey but were produced elsewhere.Netflix’s “The Watcher,” based on the enduring mystery about a series of letters from an anonymous stranger targeting the new owners of a Westfield home, was produced in Rye, New York.“The Good Nurse” is about a nurse from New Jersey, Charles Cullen, who pleaded guilty to killing at least 29 people from 1988 to 2003 while working at hospitals in New Jersey and Pennsylvania.
-Ryan Skove
Will Remote Work Continue in 2023?
With recession worries growing, power may shift back to employers and threaten perks gained during the pandemic.
If the US job market continues to weaken next year, companies will be emboldened and may pull back on letting employees work remotely.
Executives generally fall into two camps on working from home, which surged during the pandemic when workers gained leverage during a tight labor market. Some believe it has advantages, like happier employees, while others say company culture is built in the office.“There's a genuine divergence between organizations,” said Melissa Swift, a workforce transformation leader at consultant Mercer. “You're starting to see companies pick sides.”
That said, remote work looks like it’s here to stay. Gallup projects that about 75% of remote-capable workers will be hybrid or fully remote in the long term.
Here are the top reasons why experts say remote work will continue in 2023:
1. Retention
Allowing remote work is crucial for retention.
Hybrid work boosted employee satisfaction and productivity, slashing attrition by 35%, according to a study published this summer by researchers at Stanford University, the University of Chicago, and the Instituto Tecnológico Autónomo de México.
“Employees experienced new levels of fulfillment working from home, and it has been hard for companies to justify walking that back,” said Caitlin Duffy, research director at consulting firm Gartner.
Meanwhile, turnover has become an expensive problem as quit rates remain above pre-pandemic levels. In a labor market that remains tight, many companies can’t afford to hemorrhage talent. That’s especially true for high performers, even if the economy sours, according to Prithwiraj Choudhury, an associate professor at Harvard Business School.
“In any economic environment, top talent always has outside options,” said Choudhury, who studies remote work.
2. Recruitment
Remote work opens recruiting to a bigger geographic area and a larger talent pool. That’s a major advantage, especially for specialized roles where qualified candidates are hard to find. It also gives employers, such as the US Department of Veterans Affairs, which has struggled to convince people to move to Washington, a better shot at winning talent from tech hubs on the West Coast.
Offering work flexibility can also support a company’s diversity, equity and inclusion initiatives. That’s especially the case for groups, like disabled workers, who were often shut out of the labor market. Working parents and people of color have also reported tremendous benefits from remote work.
3. Recession cost cuts
Rather than reversing the shift to remote work, a recession might accelerate the trend because it can reduce the need for office space and help companies cut costs, according to Choudhury.
This summer, Yelp Inc. closed its New York, Chicago, and Washington offices with plans to put the savings toward hiring and employee benefits. Not long after, Lyft Inc. rented out about half of its office space in San Francisco, New York, Seattle, and Nashville. Other major companies, such as Meta Platforms Inc. and Amazon.com Inc., have scaled back office expansion plans.
Employees who are allowed to work from home are willing to take a pay cut in exchange for greater flexibility and lower commuting costs. Work-from-anywhere policies also allow bosses to keep labor costs down by hiring in states, such as Idaho, Louisiana, and Kansas, that have lower costs of living.
4. Reversal risks
If a company does an about-face, executives risk damaging their reputation. Just look at Twitter. In an effort to shake up the company last month, new Chief Executive Officer Elon Musk ended the company’s remote work model. But so many employees opted for severance instead that he had to soften his stance to coax some staff back.
Taking maximum advantage of leverage in this way isn’t a good long-term strategy, according to Ben Granger, the chief workplace psychologist at Qualtrics.
“Future candidates can see the comments from employees who left,” Granger said. “They can read the articles. Leaders would be wise to think about that.”
"No One" Buying or Selling Existing Homes
30YR Fixed
6.32%
+0.04%
15YR Fixed
5.57%
+0.02%
"No One" Buying or Selling Existing Homes
"No one" is a relative term when it comes to economic data. There are actually about 4 million people per year buying existing homes based on the annualized and seasonally adjusted pace in the latest installment of the data released today for the month of November. But relative to most of the past 25 years, this is about as low as it gets.
Officially, the National Association of Realtors (NAR) reported existing sales at a pace of 4.09 million, well off the median forecast of 4.20 million and even farther below the previous reading of 4.43 million. Sales hit their most recent peak in January and have declined every month since then.
After more than a year of explosive growth (in both sales and prices) following by the fastest rate spike to the highest levels in decades, it's no surprise to see home sales pulling back. It's also logical that existing sales are being hit particularly hard because, unlike new homes, existing sales rely on an existing occupant (in most cases) needing to procure new housing. With prices/rates/rents/etc as high as they are, it has discouraged the migration necessary to create the inventory.
This is actually a bit of a silver lining as it means we might be seeing better sales numbers if there were more inventory. At the very least, we can see that the current environment is distinctly different from the Great Financial Crisis which saw inventories surge as buyers went on strike.
What's next for the existing home market? We're only now getting to the early stages of the next phase in this cycle. Prices may be falling in month-over-month terms (they always do in the 2nd half of the year), but the annual pace of appreciation is still over 3.5%.
The evolution of the next phase of the cycle will depend on the extent to which rates and prices continue to moderate. While it can't work miracles, better affordability should help soften the inventory crunch. In turn, those developments will depend on the nature of inflation and economic data in the coming months.
Building Permits Fall Well Below Housing Starts For First Time in Over 2 Years
30YR Fixed
6.38%
+0.11%
15YR Fixed
5.54%
+0.02%
Building Permits Fall Well Below Housing Starts For First Time in Over 2 Years
Housing Starts, the jargon word used to refer to the inception of new residential construction, have a reasonably logical relationship with building permits. The latter tends to run a bit higher on average since the Great Financial Crisis, but there has been plenty of overlap.
Since the start of the pandemic, however, building permits opened up a clear lead on housing starts and never looked back--at least not until today's data came out. Granted, there was one month in the middle of 2021 where starts eclipsed permits by a few thousand units, but that was nothing compared to today's gap of 85k.
Long story short, the orange line finally fell well below the blue line:
Does this tell us anything we didn't already know about the housing market? Not really. Post-covid labor/material challenges made it impossible for construction to start as quickly as builders pulled permits. The higher permitting levels spoke to the incredibly tight housing market. With things shifting abruptly in 2022, it's a surprise that we didn't see the more forward-looking permit numbers fall sooner.
It was a massive drop for multifamily permits (5 or more units), which dropped 18% month-over-month, while single-unit permits only declined 7.1%. Incidentally, the 2-4 unit sector has been the most stable (UP 2.0% month over month and 8.3% year-over-year), but only a tenth of the size of the 5+ unit market.
While multifamily permits may be down in year-over-year terms as well, builders continue to clear the backlog based on housing starts. For instance, Y/Y permits for 5+ units are down just over 10%, but Y/Y housing starts for 5+ units are UP 24.5%. Contrast that to single-family housing starts, which are down 32.1%.
The takeaway from these discrepancies continues to be that builders increasingly focused on multifamily construction as affordability eroded. That was enough to buoy construction numbers for a while, but that time is done, and the numbers are falling in line with the indications from builder sentiment.
Homeowners Still Have Positive Equity Gains over the Past 12 Months
If you’re a homeowner, your net worth got a big boost over the past few years thanks to rapidly rising home prices. Here’s how it happened and what it means for you, even as the market moderates.
Equity is the current value of your home minus what you owe on the loan.
Because there was a significant imbalance between the number of homes available for sale and the number of buyers looking to make a purchase over the past few years, home prices appreciated substantially.
And while home price appreciation has moderated this year, and even depreciated slightly in some overheated markets, that doesn’t mean you’ve lost all the equity you gained during the pandemic frenzy.
To prove you still have equity you can use, the latest Homeowner Equity Insights from CoreLogic finds the average homeowner equity has actually grown by $34,300 over the past 12 months.
That’s right, despite the headlines, the average homeowner still gained positive equity over the last year in just about every market. While the gains aren’t as dramatic as they were in the previous quarter due to home price moderation, they’re still significant. And if you’ve been in your home for longer than a year, chances are you have even more equity than you realize.
While that’s the national number, if you want to know what happened over the past year in your area, look at the map below from CoreLogic:
Why This Is So Important Right Now
While equity helps increase your overall net worth, it can also help you achieve other goals, like buying your next home. When you sell your current house, the equity you’ve built up comes back to you in the sale, and it may be just what you need to cover a large portion – if not all – of the down payment on your next home.
So, if you’ve been holding off on selling because you weren’t sure what the headlines meant for your bottom line, rest assured you’ve still gained equity in recent years, and it can help fuel your move.
Bottom Line
If you’re planning to make a move, the equity you’ve gained over time can make a big impact. To find out just how much equity you have in your current home and how you can use it to fuel your next purchase, let’s connect.
Mortgage Rates Are Dropping. What Does That Mean for You?
Mortgage rates have been a hot topic in the housing market over the past 12 months. Compared to the beginning of 2022, rates have risen dramatically. Now they’re dropping, and that has to do with everything happening in the economy.
Nadia Evangelou, Senior Economist and Director of Forecasting at the National Association of Realtors (NAR), explains it well by saying:
“Mortgage rates dropped even further this week as two main factors affecting today's mortgage market became more favorable. Inflation continued to ease while the Federal Reserve switched to a smaller interest rate hike. As a result, according to Freddie Mac, the 30-year fixed mortgage rate fell to 6.31% from 6.33% the previous week.”
So, what does that mean for your homeownership plans? As mortgage rates fluctuate, they impact your purchasing power by influencing the cost of buying a home. Even a small dip can help boost your purchasing power. Here’s how it works.
The median-priced home according to the National Association of Realtors (NAR) is $379,100. So, let’s assume you want to buy a $400,000 home. If you’re trying to shop at that price point and keep your monthly payment about $2,500-2,600 or below, here’s how your purchasing power can change as mortgage rates move up or down (see chart below). The red shows payments above that threshold and the green indicates a payment within your target range.
This goes to show, even a small quarter-point change in mortgage rates can impact your monthly mortgage payment. That’s why it’s important to work with a trusted real estate professional who follows what the experts are projecting for mortgage rates for the days, months, and year ahead.
Bottom Line
Mortgage rates are likely to fluctuate depending on what happens with inflation moving forward, but they have dropped slightly in recent weeks. If a 7% rate was too high for you, it may be time to contact a lender to see if the current rate is more in line with your goal for a monthly housing expense.
Ryan Skove
Phone:+1(732) 301-2687